

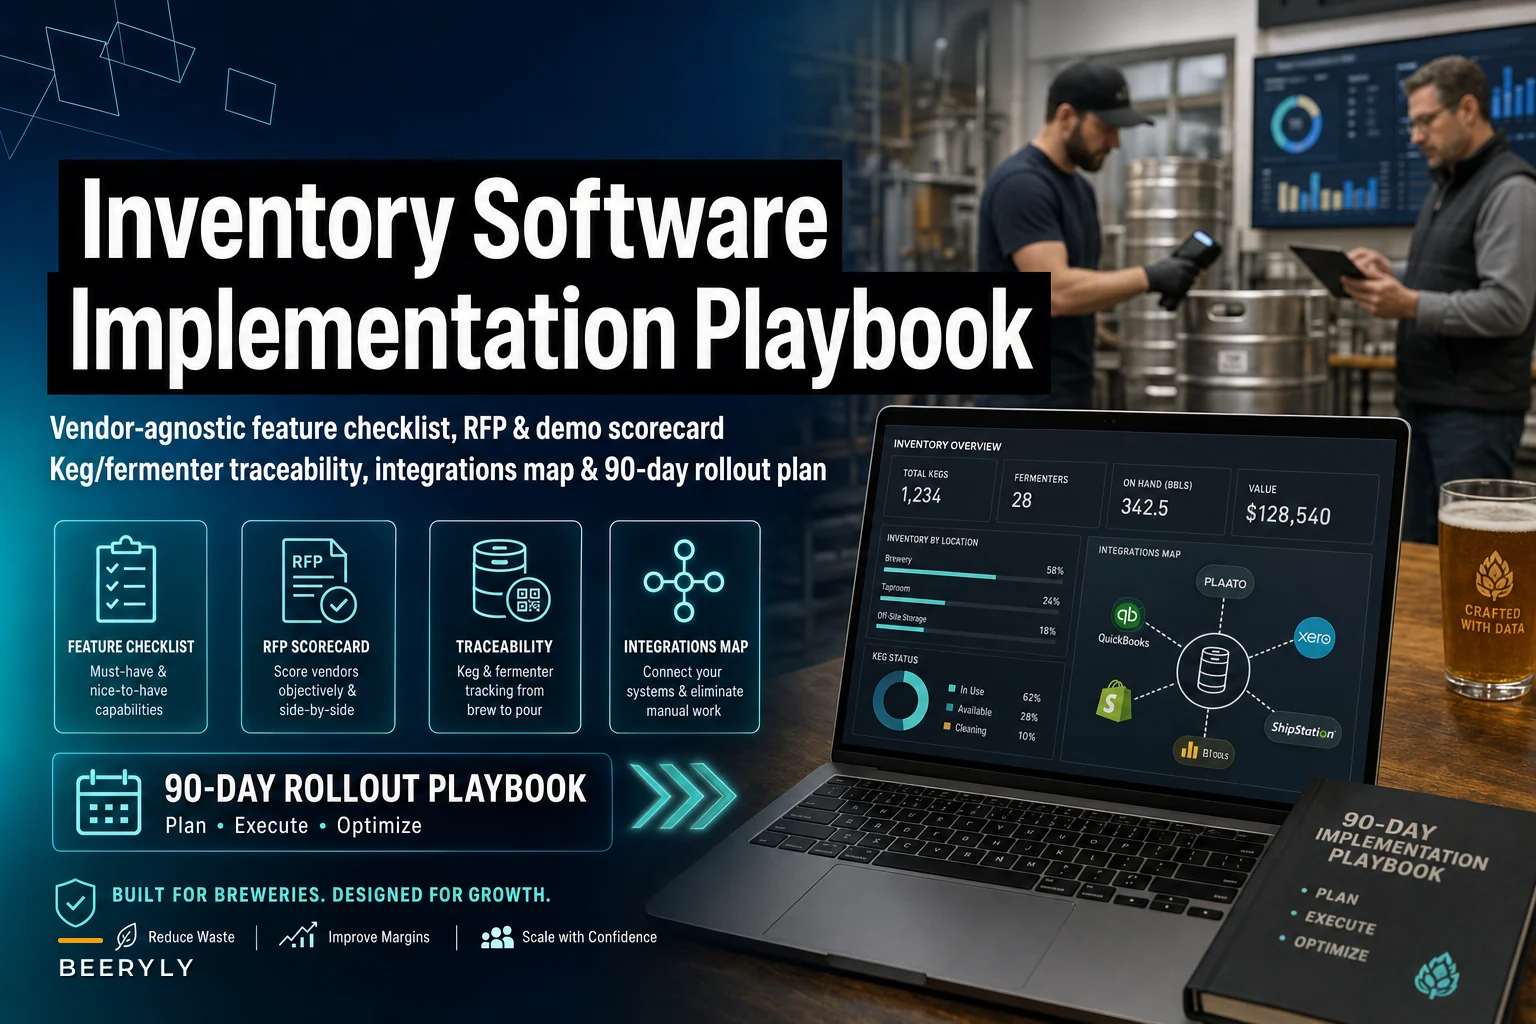

Most brewery software evaluations go sideways for the same reason: the demo looks great, everyone nods, and then six weeks after go‑live the cellar crew is still writing keg counts on masking tape because the system doesn't match how they actually work. The gap isn't the software. It's that nobody scored the vendors against the real workflow, nobody planned the data migration, and nobody assigned ownership for the messy parts.
This guide is built to close that gap. It's vendor‑agnostic on purpose — you're going to score three or four options against the same yardstick, then run a disciplined 90‑day roll‑out. Everything below is editable. Copy the tables, change the weights, delete the rows that don't apply to a five‑BBL brewpub or a 40k‑BBL regional. The point is to make the decision on evidence instead of demo charm.
Start with the feature checklist — but rank it, don't just list it
The mistake almost everyone makes is treating a feature list as a checkbox exercise. Every vendor will claim they do lot tracking, keg management, and mobile scanning. What separates them is how deep each capability goes and whether it survives contact with your floor.
Instead of a flat list, prioritize features into three tiers. Tier 1 is non‑negotiable — if it's weak, you walk. Tier 2 is important but you can live with a workaround for a quarter. Tier 3 is nice‑to‑have.
| Feature | Priority | What "good" actually looks like |
|---|---|---|
| Lot / batch traceability | Tier 1 | One‑click backward and forward trace from finished SKU to raw material lot in under a minute; captures supplier lot numbers on receiving |
| Raw material inventory (grain, hops, yeast, adjuncts) | Tier 1 | Tracks by lot with expiration/best‑by, deducts on brew via recipe, flags negative on‑hand |
| Keg / container tracking | Tier 1 | Individual or bulk keg states (full, empty, dirty, at‑customer, lost), deposit accounting, aging report |
| Yield & loss tracking by batch | Tier 1 | Compares planned vs actual at each stage (brewhouse, cellar, packaging), surfaces variance % |
| Mobile scanning (barcode/QR) | Tier 1 | Works offline on the floor, syncs later, cheap handheld or phone‑based |
| FIFO / expiration enforcement | Tier 2 | Suggests oldest lot on pick/consume; warns on skips |
| Recipe / bill‑of‑materials versioning | Tier 2 | Locks a recipe version to a batch so cost is reproducible |
| Finished goods by SKU + package format | Tier 2 | Same beer in 1/6 BBL, 1/2 BBL, 12oz can, 4‑pack tracked separately |
| Production scheduling hooks | Tier 2 | Feeds or reads from your schedule so on‑hand reflects committed brews |
| Costing / COGS roll‑up | Tier 3 | Lands landed cost of materials into batch cost automatically |
| Lab / QC result attachment | Tier 3 | Attaches pH, ABV, DO, micro results to the batch record |
One insight that saves months: the traceability demo is usually rigged. Vendors trace a clean sample batch. Ask them to trace a batch that was blended from two fermenters, or one where a hop lot ran out mid‑dry‑hop and got topped off with a second lot. That's the real world. If the trace breaks or requires manual notes, your recall readiness is fiction. If lot‑level tracking is a compliance priority, this is where the whole evaluation lives or dies.
Worth flagging separately: yield tracking is where cheaper systems quietly fall apart. A lot of tools let you record a batch and a final package count but never force the intermediate measurements. Without brewhouse‑to‑package yield capture at each stage, you can't tell whether you're losing beer to tank heels, over‑foaming on the filler, or a recipe that's just optimistic on attenuation. The whole point of the software is to make that loss visible. If yield tracking is an afterthought in the demo, the tool is really just a fancy spreadsheet.
The integrations map — draw it before the first demo
Inventory software doesn't live alone. It sits in the middle of your POS, your online store, your accounting system, and sometimes your lab or CIP logs. The failure mode here is buying a great inventory tool that can't talk to QuickBooks, then having someone re‑key invoices by hand indefinitely.
Take control of your brewery’s workflow.
Beeryly helps you schedule batches, track inventory, and monitor sales with ease.
- Production timeline management
- Inventory tracking & alerts
- Sales & distribution monitoring
No credit card required
Sketch this map on one page before you talk to anyone. For each connection, write down the direction of data flow and how often it needs to sync.
-
POS (taproom) → Inventory depletes finished goods as pints/cans/crowlers sell. Needs near‑real‑time or at least end‑of‑day. Watch for how it handles a pour vs a full package.
-
E‑commerce → Inventory online orders reserve and deplete stock. If you run limited releases, oversell protection matters more than sync speed.
-
Inventory → Accounting COGS, inventory valuation, and PO/receiving into your GL. Usually a nightly or weekly sync. This is where most manual re‑entry hides.
-
Distributor / wholesale orders → Inventory reserves keg and case inventory against open orders.
-
Lab / QC system → Batch record ABV, pH, DO, micro results attached to the lot. Often manual or CSV import — that's fine if it's clean.
-
CIP / cleaning logs → Batch / tank record proves a tank was cleaned before fill. Frequently a separate system; a link or reference field is usually enough.
The connection that causes the most post‑go‑live pain is almost never the flashy POS one — it's accounting. Breweries consistently underestimate how many small reconciliations happen between receiving raw materials, packaging finished goods, and the numbers the bookkeeper actually posts. Ask every vendor to show you the accounting sync with a returned keg and a credit memo, not just a clean sale.
If your online and taproom demand swings hard by season, the e‑commerce and POS integrations need to reflect committed inventory accurately, or you'll oversell a limited drop. Getting production and sales channels aligned is a whole discipline — the 90/30/7 production‑to‑commerce planning system pairs well with whatever tool you land on.
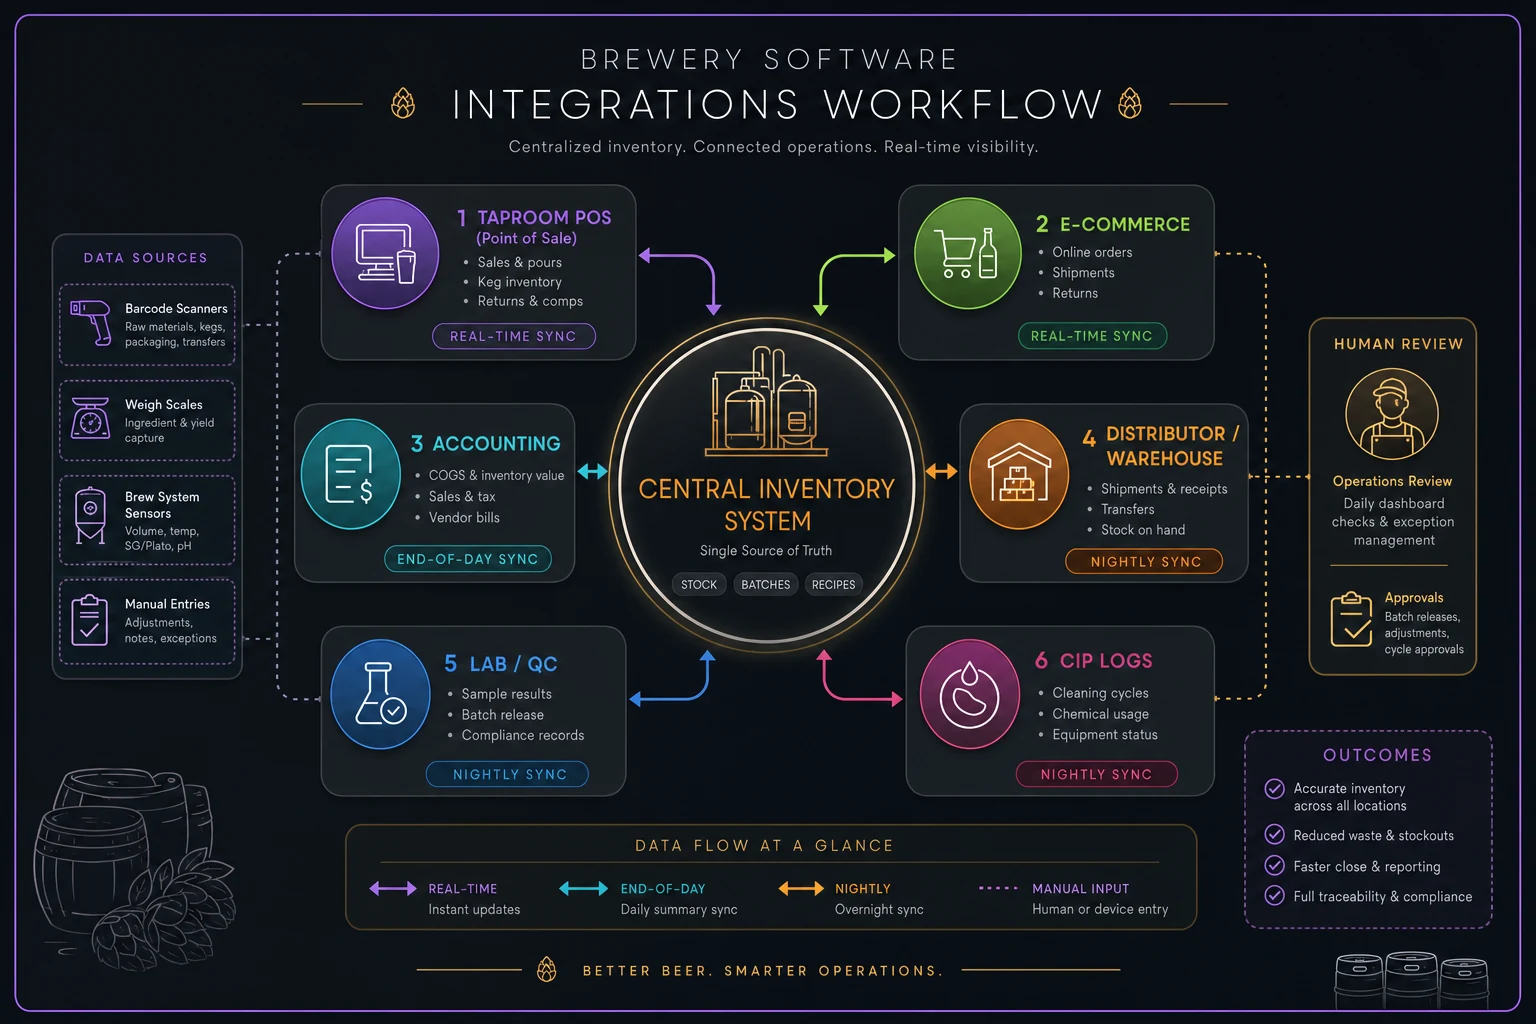
Use this sketch to label data flow direction and sync cadence before you talk to vendors.
The RFP / demo scorecard (editable)
Don't evaluate from memory. After three demos in a week, every system blurs together and you'll pick the one with the friendliest salesperson. Score each vendor live, during the demo, on the same sheet.
Here's a scoring model. Weight each category by how much it matters to your operation, score each vendor 1–5, multiply, and total.
| Category | Weight | Vendor A (1–5) | Vendor B | Vendor C |
|---|---|---|---|---|
| Lot/batch traceability depth | 20% | |||
| Yield & loss tracking | 15% | |||
| Keg lifecycle & deposits | 15% | |||
| Mobile / offline floor use | 10% | |||
| Accounting integration | 12% | |||
| POS / e‑commerce integration | 8% | |||
| Ease of daily use (floor crew) | 10% | |||
| Reporting & variance visibility | 5% | |||
| Support & implementation help | 5% | |||
| Weighted total | 100% |
-
Have the person who'll actually use it score the "ease of daily use" row. Not the owner. The packaging lead. If they can't complete a scan‑and‑deplete without asking three questions, that's a 2, no matter how slick the dashboard looks.
-
Score "support & implementation" on a real answer, not a promise. Ask: "Who does our data migration, you or us? How many hours of onboarding are included? What's the response time when something breaks during a canning run?" Vague answers get a 2.
One useful trick during demos: bring one weird real scenario from your own brewery and make every vendor solve it live. A keg that was filled, sent out, came back dirty, got re‑cleaned, and refilled with a different beer. How does the software handle that container's history? You learn more from that one question than from an hour of feature parade.
Total Cost of Ownership — the number that isn't on the pricing page
Subscription price is the smallest part of what you'll actually spend. The line items that surprise breweries are the ones nobody quotes upfront.
Build a simple three‑year TCO worksheet. Add these:
-
Subscription (per user or per location, monthly × 36)
-
Implementation / onboarding fee (often one‑time, sometimes buried in "premium support")
-
Data migration (either a vendor fee or your team's hours)
-
Hardware — handheld scanners, label printers, tablets for the floor. Ruggedized scanners run more than most people expect.
-
Integration setup — some accounting or e‑commerce connectors cost extra or require a middleware subscription
-
Training time — your staff's hours, at their loaded cost, during ramp‑up
-
Ongoing admin — someone owns this system; budget a few hours a week
-
Upgrade / tier jumps — what happens to price when you add a location or cross a BBL threshold
A realistic example for a small production brewery in the 3,000–5,000 BBL range: the software might quote around $400–$700/month, which looks like $15k–$25k over three years. Add a couple of rugged scanners and a label printer (~$2k–$4k), migration and setup (~$3k–$6k whether you pay the vendor or eat the internal hours), and 40–60 hours of staff training time — the real three‑year number often lands closer to $30k–$40k. Not a dealbreaker, but very different from the sticker.
The cheapest subscription is frequently the most expensive system, because weak onboarding and clunky floor tools push more work back onto your people. Underpriced tools tend to underinvest in migration support, and you pay for that in chaos during the first few months.
If you're weighing this software spend against a tank or packaging line purchase in the same budget cycle, treat it with the same rigor — the operational readiness checklist for capital planning applies to systems as much as steel.
Data migration and SKU mapping — where roll‑outs actually fail
You can pick the perfect system and still botch the launch if the data going in is garbage. Migration is boring, and it's where the majority of the pain lives. The single biggest cause of a rough go‑live is a messy SKU list that nobody cleaned first.
Brewery SKUs accumulate naming chaos fast. The same beer becomes five or six different stock items across formats, and over the years people invented inconsistent shorthand. "Hazy IPA 1/2 bbl," "HazyIPA-HB," "Hazy — half barrel" all referring to the same thing. Migrate that mess as‑is and your reports are useless from day one.
Data migration & SKU mapping checklist:
-
[ ] Export your current item list (from POS, spreadsheets, old system) into one place
-
[ ] De‑duplicate — merge the three names that mean the same SKU
-
[ ] Establish a naming convention (e.g.,
BEER-STYLE-FORMAT-SIZE) and apply it consistently -
[ ] Separate active SKUs from discontinued ones — don't migrate dead weight
-
[ ] Map every old SKU to exactly one new SKU (keep a crosswalk sheet)
-
[ ] Confirm units of measure are consistent (lbs vs kg for hops, gallons vs BBL)
-
[ ] Load raw material lots with real on‑hand counts from a physical count, not the old system's guess
-
[ ] Verify recipe BOMs — quantities and correct linked materials
-
[ ] Migrate open POs and outstanding keg deposits
-
[ ] Run a parallel week
old method + new system side by side, reconcile daily
-
[ ] Sign‑off
designated owner confirms opening balances match physical reality
That physical count line is the one people skip and regret. Never trust migrated on‑hand numbers. Count the warehouse, count the cooler, count the kegs, and set opening balances from what's actually on the floor. The migrated number is almost always wrong, and if you don't reset it, every variance report for the next six months inherits that error.
Never trust migrated on‑hand numbers—count the warehouse, count the cooler, count the kegs, and set opening balances from the physical count.
That physical count line is the one people skip and regret. Never trust migrated on‑hand numbers. Count the warehouse, count the cooler, count the kegs, and set opening balances from what's actually on the floor. The migrated number is almost always wrong, and if you don't reset it, every variance report for the next six months inherits that error.
The 90/60/30‑day implementation timeline with role assignments
Roll‑outs drift when nobody owns the phases. Assign a name to each block. "The team" is not a name.
The 90/60/30 breakdown gives clear ownership and checkpoints for data, parallel runs, and cutover activities.
Days 1–30: Foundation and data
-
Project owner (usually production manager)
finalize vendor, sign, kick off
-
Ops/admin lead
clean and map SKUs, build naming convention
-
Cellar & packaging leads
physical counts of raw materials, finished goods, kegs
-
Bookkeeper/accountant
map GL accounts, confirm accounting integration fields
-
Configure the system
recipes, BOMs, locations, user roles
-
Set up mobile scanning hardware and test it on the floor, not in the office
Days 31–60: Parallel run and training
-
Run the new system alongside current process for at least two weeks
-
Each shift enters data both ways; reconcile daily and log every discrepancy
-
Train each role on their screens only — don't drown the canning crew in accounting reports
-
Fix the top friction points the crew reports (there will be a handful that matter)
-
Validate one full backward trace and one forward trace with real batches
Days 61–90: Cutover and stabilize
-
Set the go‑live date away from your busiest packaging week
-
Cut over; retire the old method — this needs to be a hard stop, not a gradual fade
-
Daily standup for the first two weeks
what broke, who owns the fix
-
Lock opening balances, confirm first accounting sync reconciles
-
Owner signs off that all Tier 1 features work in production
The parallel run is the part everyone shortens to save time, and it's also the part that prevents disaster. Two weeks of dual entry feels painful, but it surfaces workflow mismatches while you still have the old system as a safety net. Teams that skip it go live blind and spend the next quarter firefighting instead of brewing.
Pick your go‑live date deliberately too. Launching a new inventory system the week before a major seasonal push is asking for trouble. If your calendar has predictable pressure points — holiday shipping, festival season — plan around them the same way you'd plan around a peak‑season shipping surcharge.
Post‑go‑live KPIs and governance — how you know it worked
Going live is not success. Success is the system staying accurate three months later, when the novelty's worn off and people are tempted to cut corners. That requires a small set of measured KPIs and a few governance rules that don't bend.
KPIs worth tracking from day one:
-
Inventory accuracy % — cycle count vs system, by category. Target 95%+ on finished goods, 90%+ on raw materials within the first quarter.
-
Yield variance by batch — planned vs actual, watched for trends. A creeping loss on one recipe is a signal, not noise.
-
Traceability response time — how long a full lot trace takes. Should be under a couple minutes. If it's climbing, data hygiene is slipping.
-
Keg turn / dwell — how long kegs sit at customers or empty in the yard. Ties directly to working capital.
-
Stockout & oversell incidents — count them. Should trend down after go‑live; if not, the sync isn't trusted.
-
Manual override / correction count — how often people bypass the system. Rising overrides mean the workflow doesn't fit and needs fixing before it quietly collapses.
Governance rules that keep the data clean:
-
Every material and finished SKU has one named owner responsible for its accuracy. No orphan data.
-
Cycle count cadence, in writing — a defined percentage of SKUs counted weekly, not a chaotic annual scramble.
-
No transaction skips. If a keg moves, it gets scanned. The first time "we'll enter it later" becomes acceptable, the numbers start to rot.
-
A monthly reconciliation between inventory value and the accounting system, with variances above a threshold investigated, not shrugged off.
Breweries whose system still works a year later all share one habit: they treat the override count as the canary. When people start working around the software, that's the early warning that a workflow broke — and they fix the workflow instead of nagging the staff. Systems don't fail loudly. They erode, one skipped scan at a time.
The tools matter less than the discipline you bring to choosing and deploying them. A mid‑tier system with a clean SKU list, a real parallel run, and enforced governance will outperform a premium platform dumped on a team that never counted the warehouse. Score the vendors on the same sheet. Build the full TCO, not the sticker. Clean the data before you migrate it. Assign a name to every phase and every SKU. Measure accuracy after the excitement fades — because that's when it actually counts.
Do those things and the software becomes what it's supposed to be: the place your whole operation looks to for the truth about what beer, materials, and kegs you actually have. Skip them, and you've just bought a very expensive way to keep writing counts on masking tape.
Ready to elevate your brewery operations?
Join 500+ craft breweries using Beeryly to increase production efficiency, reduce waste, and grow sales.


