


Why two beers with the same recipe can have completely different margins
Most breweries know their cost per barrel at the tank. That number gets quoted in meetings, printed on spreadsheets, and used to argue about pricing. The problem is that cost-per-barrel becomes basically useless the moment beer leaves the fermenter, because two SKUs brewed from the exact same batch can end up with wildly different real margins depending on how they're packaged, sold, and delivered.
A 16oz four-pack going to a distributor and a half-barrel keg going to a taproom next door do not cost the same to serve, even if the liquid inside is identical. One carries aluminum, cardboard, labor-heavy packaging, distributor margin, chargebacks, and cold-chain freight. The other is essentially raw beer in a returnable container moving 30 feet.
This is the gap that quietly kills brewery profitability. You can be growing revenue, winning shelf space, adding accounts — and slowly bleeding margin because your fastest-growing SKUs happen to be your worst cost-to-serve performers. That's the whole point of building a brewery cost to serve model — catching it before it shows up in a bad year-end P&L.
What follows is a template-first approach to building this. Not theory — an actual cost stack you can populate per SKU, with decision thresholds that tell you when to reprice, kill, or restructure a product.
The cost stack: where a beer actually loses money
Before building any worksheets, you need to agree on the layers. A SKU's fully-loaded cost isn't one number — it's a stack, and each layer has its own failure points.
Here's the stack, from liquid up:
| Cost layer | What it captures | Where it hides |
|---|---|---|
| Raw material per batch | Malt, hops, yeast, adjuncts, water/utilities allocated to the brew | Underweighting dry-hop-heavy SKUs |
| Yield loss | Losses from brewhouse to packaged units (trub, transfer, tank heels, packaging waste) | Almost always undercounted |
| Packaging materials | Cans, cardboard, labels, PakTech, film, CO2, keg wear | Small-run SKUs eat overhead |
| Packaging labor | Line time, changeovers, QC holds allocated per unit | Short runs = brutal per-unit labor |
| Cold-chain delivery | Freight, refrigerated transport, fuel, route inefficiency | Long-haul small drops |
| Channel fees | Distributor margin, retailer chargebacks, slotting, POS | Self-distribution masks it |
| Returns & shrink | Out-of-code returns, damaged product, lost containers | Nobody assigns an owner |
The mistake most breweries make is stopping at the first two rows. They know malt and hops cold, they'll debate yield loss, and then treat everything downstream as "overhead" — one blended number spread evenly across every SKU. That averaging is exactly what makes a bad SKU invisible. Your simple pale ale in kegs ends up subsidizing your triple-dry-hopped hazy in four-packs, and the blended average looks fine on paper.
—
Start with yield loss, because that's where the lying begins
If you only fix one input, fix yield loss. This is where cost models drift furthest from reality — breweries plug in a clean theoretical number, say 5% total loss, and never reconcile it against what actually gets packaged.
Take control of your brewery’s workflow.
Beeryly helps you schedule batches, track inventory, and monitor sales with ease.
- Production timeline management
- Inventory tracking & alerts
- Sales & distribution monitoring
No credit card required
A typical example: a 20 BBL brew that "should" yield around 40 half-barrels' worth of packaged beer ends up producing the equivalent of 37 after trub loss, transfer heels, a slightly aggressive dry-hop soak, and packaging line waste. That's roughly 7–8% loss, not 5%. On a per-SKU basis that gap doesn't sound dramatic, but it compounds through the entire stack — you're spreading the same fixed packaging and freight costs across fewer sellable units.
The pattern gets worse for hop-forward styles. Dry-hop absorption can pull off a meaningful chunk of volume, and haze-focused beers often carry the highest yield loss and the most expensive raw material bill simultaneously. The SKU that markets best is frequently the one hemorrhaging margin on two layers at once.
Build yield reconciliation into your packaging checklist: tie run sheets to packaged-case counts before you close the batch.
Build your model with actual reconciled yield per SKU family, not a plant-wide average. Ales, lagers, and heavily dry-hopped beers should each carry their own loss factor. If you're not measuring transfer and packaging loss separately, start there — it's the single biggest source of a model that says one thing while the bank account says another.
Building the per-batch raw material line
Raw material per batch is the layer most breweries feel confident about, and mostly they're right — but there are two places it slips.
First, utilities and water tied to the brew almost never make it into the per-SKU material line. They get lumped into facility overhead. These costs vary more than people realize by style and process length. A long-boil, multi-step mash beer costs meaningfully more to produce than a quick single-infusion pale, and extended whirlpool or decoction adds real energy load. Allocating even a rough per-batch utility figure sharpens the picture considerably.
Second, CO2 and process gas. With CO2 pricing moving the way it has, carbonation and purging costs are no longer rounding errors — especially for canned product where you're purging cans and carbonating to spec. Assign it somewhere: partly in materials, partly in packaging depending on where it's consumed, but it needs to live on the sheet.
A clean per-batch material worksheet should contain: grain bill cost, hop cost (broken into kettle vs. dry-hop so you can see the expensive part clearly), yeast cost including repitch value or pitch cost, adjuncts, process water and utilities allocation, and gas. Divide by reconciled sellable units — not theoretical — and you have a real material cost per unit for that SKU.
Packaging: where small runs quietly destroy margin
Packaging is where per-SKU costs diverge hard, and it's the layer breweries most often average incorrectly.
Materials scale reasonably — a can costs roughly what a can costs. Labor and changeover do not scale down. A short 15 BBL run of a specialty SKU carries the same setup, sanitation, and changeover burden as a full-day run, spread across a fraction of the units. Per-unit packaging labor on a small limited release can run several times higher than your flagship, and almost nobody prices that in.
The pattern is predictable: breweries add SKUs to look full and interesting on shelf, each one requiring its own labels, films, and changeovers. The packaging line's real cost per unit creeps up while the schedule fragments. The flagship absorbs the disruption, the specialty SKU shows a healthy "material" margin, and the true cost-to-serve on those small runs is buried in general labor.
-
Direct materials (cans/bottles, cardboard, labels, PakTech/film, glue, CO2 for purge)
-
Line labor at actual run rate, not full-speed theoretical rate
-
Changeover time allocated across that run's units
-
QC hold and any rework/dumping tied to that packaging format
-
Keg wear and float cost for draft SKUs
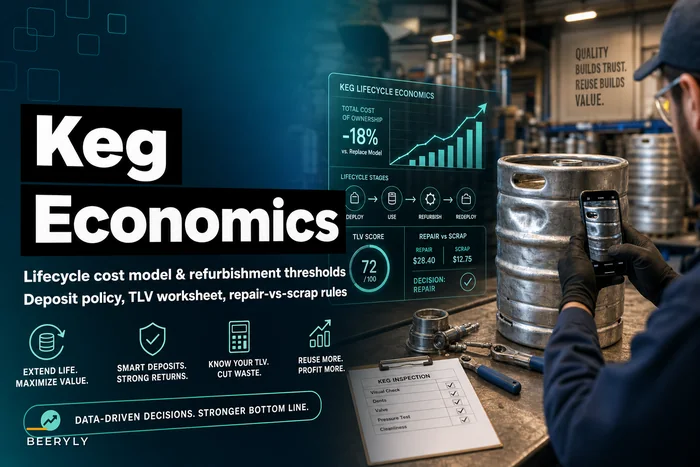
That last one matters more than people think. Draft economics look great until you account for container float, loss, and refurbishment. If you haven't worked through container lifecycle math, the keg lifecycle economics and deposit policy framework covers how to load those numbers so kegged SKUs carry their fair share.
Cold-chain, freight, and the geography problem
Delivery cost is where the model finally connects to the real world, and it's almost never uniform per unit. Two things drive it: distance and drop density.
A distributor pickup of a full pallet is cheap per case. A self-distributed run to five small accounts across a metro, in a refrigerated vehicle, with a driver's time and fuel and the inefficiency of small drops, can cost multiples more per case. When breweries self-distribute and don't allocate driver labor and vehicle cost per delivered unit, draft and small-format DTC volume looks far more profitable than it actually is.
Cold-chain adds another wrinkle. Anything that must stay cold — hazy IPAs, unpasteurized product — carries refrigerated freight cost and a shorter shelf window, which ties directly into spoilage and returns downstream. If you're modeling perishable SKUs, cost-to-serve and inventory risk are the same conversation; the perishable-inventory strategy for breweries walks through how holding and code-date risk compound freight cost on the products least able to absorb it.
Capture freight cost per delivered unit by channel in your worksheet: distributor pickup, self-distribution route, and DTC each get their own column. Don't blend them. Channel is a cost driver, not just a revenue source — blending hides that completely.
Channel fees and returns: the layer with no owner
Distributor margin is obvious — you know your wholesale price versus your invoice. What sneaks past is the collection of smaller drags: chargebacks, damage allowances, out-of-code returns, spoilage credits, slotting, and promotional support. Individually they look minor. Stacked across a channel, they can quietly erase two or three margin points on a SKU that looked fine on paper.
Returns are the worst offender because no one owns the number. Out-of-code product coming back — especially perishable styles that didn't move fast enough — is both a lost sale and a disposal cost. In practice this shows up as a "distribution problem" or a "sales problem" when it's actually a cost-to-serve and code-date problem: you shipped a short-shelf-life SKU into a slow channel, and the math never worked from the start.
Assign returns and channel fees at the SKU-and-channel level. A hazy IPA in cans through a distributor and the same beer poured on your own taproom draft line are not the same product financially. One eats distributor margin and return risk; the other has near-zero channel cost and gets sold at full retail.
A worked example: three packaging formats, same recipe
Take a single hoppy pale ale, brewed once, split across three formats. These are rough, illustrative numbers — the point is the shape of the difference, not the exact figures.
Scenario: 20 BBL brew, split into 16oz 4-packs (distributor), half-barrel kegs (distributor draft), and taproom draft.
| Cost-to-serve layer | 4-pack (distro) | Keg (distro) | Taproom draft |
|---|---|---|---|
| Raw material / unit | ~$0.70 / can | ~$38 / keg | ~$38 / keg equiv |
| Yield loss impact | Higher (packaging waste) | Moderate | Moderate |
| Packaging materials | ~$0.55 / can | Low (float cost) | Low (float cost) |
| Packaging labor | High (line + changeover) | Low | Low |
| Freight / cold-chain | ~$0.15 / can | Moderate / keg | ~$0 |
| Channel fees | Distributor margin + chargebacks | Distributor margin | ~$0 |
| Returns risk | High (code dates) | Low | Very low |
| Relative cost-to-serve | Highest | Middle | Lowest |
Same liquid. The taproom pint is dramatically more profitable per equivalent volume than the distributed four-pack, and it's not particularly close. Yet many breweries chase can distribution as the growth story while under-investing in the channel that actually generates the strongest margin.
That doesn't mean stop canning. It means know what each format costs to serve so you're pricing and prioritizing on real margin, not gut feel.
Decision thresholds: turning the model into action
A cost-to-serve model is only worth building if it changes decisions. Set thresholds in advance so you're not renegotiating your standards every time an ugly SKU shows up.
A practical decision process once each SKU is loaded:
-
Calculate fully-loaded margin per SKU per channel. Not blended. Each format, each channel, its own line.
-
Flag anything under your minimum margin floor. Pick a number — many breweries use a floor somewhere in the 30–40% contribution range for packaged product. Below it, the SKU is on notice.
-
Separate fixable from structural. Is the problem short-run packaging labor (fixable with scheduling), or is it a low-price channel with high return risk (structural)?
-
For fixable SKUs, batch and consolidate. Longer runs, fewer changeovers, better line utilization.
-
For structural losers, reprice or exit the channel. If a distributor SKU can't clear the floor after fixing yield and runs, it either takes a price increase or it comes home to draft.
-
Reconcile quarterly against actuals. Yield drifts, freight changes, CO2 moves. A model built once and never updated becomes fiction fast.
The single most valuable output of this whole exercise is a short list: the three SKUs that are quietly losing you money. Almost every brewery has them, and almost none can name them without doing the per-SKU math.
When this framework is worth it — and when it isn't
When it makes sense: You have more than a handful of SKUs, you're selling across multiple channels, or you're growing distribution faster than you're growing profit. If revenue is up but cash feels tighter than it should, cost-to-serve almost always surfaces the reason.
When it's overkill: A very small taproom-only operation with two or three beers and no outside distribution doesn't need a full per-SKU-per-channel model. Your cost-to-serve is essentially uniform, and the time is better spent elsewhere. Build the muscle before you need it, but don't over-engineer a two-SKU brewery.
Who should wait: If your yield loss numbers aren't reconciled and your packaging labor isn't tracked per run, don't build the full model yet. You'll get precise-looking garbage. Fix the input data first, then build the stack. A cost-to-serve model is only as honest as its yield and labor inputs.
A real scenario
A regional brewery producing somewhere around 6,000 BBL a year had grown packaged distribution steadily for two years and couldn't figure out why margins were softening while volume climbed. Cost-per-barrel at the tank looked stable. Everything on the surface looked fine.
Building cost-to-serve per SKU surfaced the problem in about a week of pulling real numbers. Two of their small-batch four-pack SKUs — both dry-hop-heavy specialty releases run in short batches — were carrying yield loss north of 8%, brutal per-unit packaging labor from frequent changeovers, and higher-than-average out-of-code returns because they moved slowly through distribution. Fully loaded, both were landing near break-even or slightly negative once channel fees and returns were counted.
The fixes weren't dramatic. They consolidated those specialty releases into fewer, larger runs to cut per-unit changeover labor, pushed one primarily to taproom and local draft where channel cost was near zero, and took a modest price increase on the other. Within a couple of quarters, contribution margin on that SKU family moved from roughly break-even into a healthy positive range. Maybe more importantly, leadership stopped adding new small-run packaged SKUs without running the cost-to-serve math first.
Volume didn't jump. The math just stopped lying to them.
Keeping the model alive
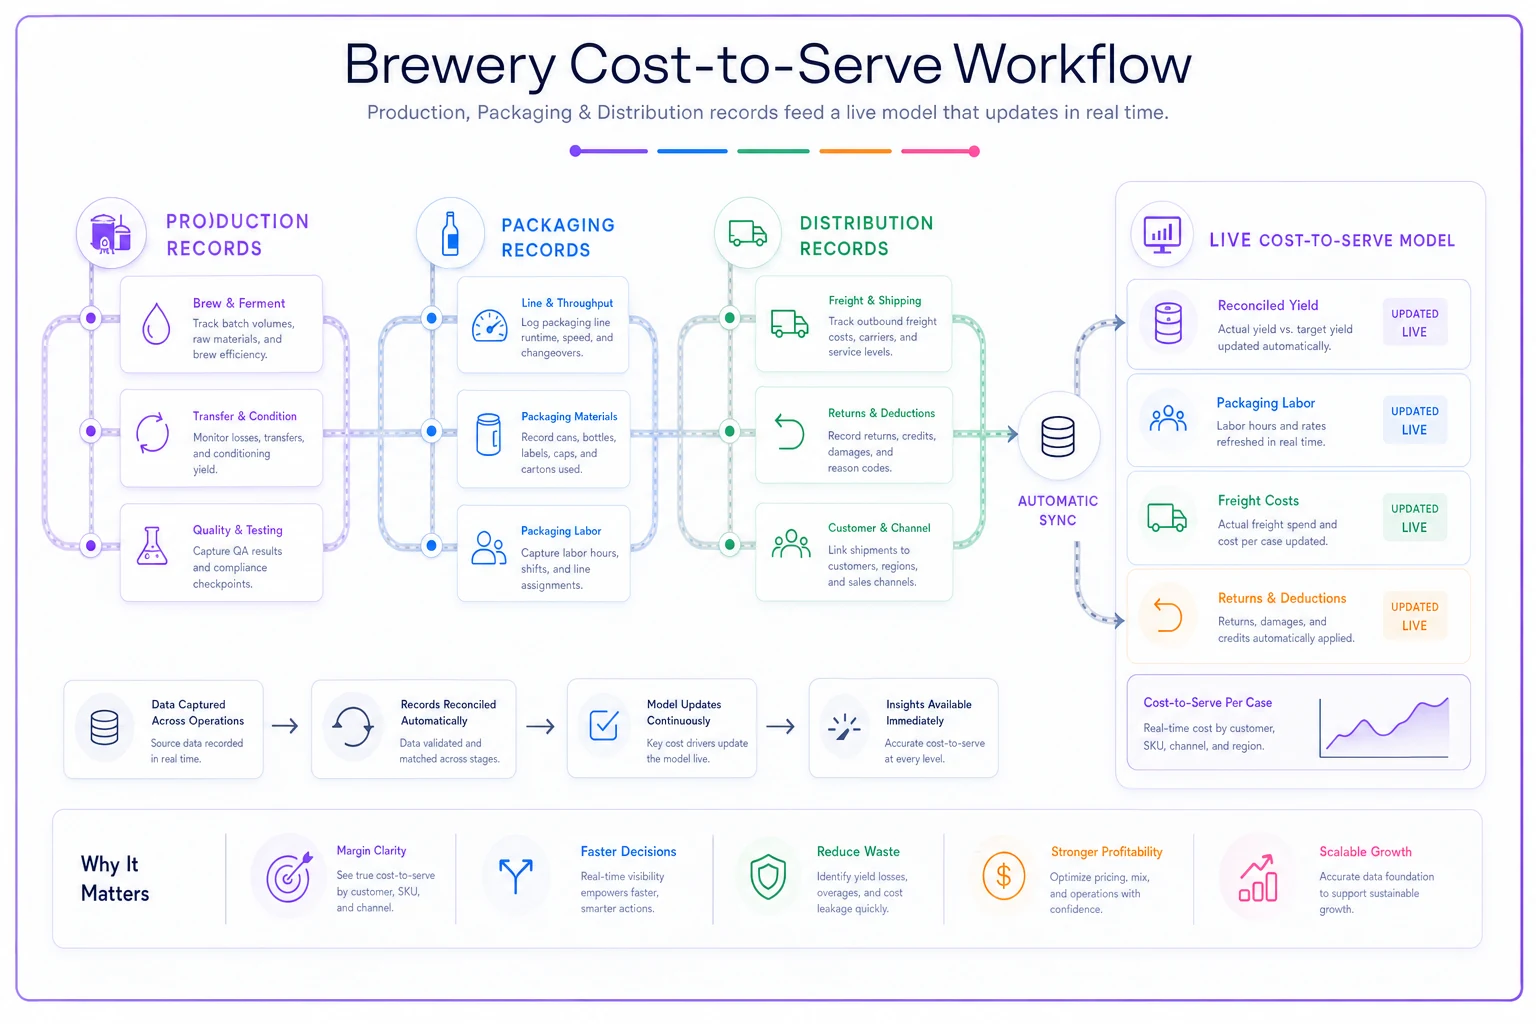
The reason most cost models die is that they're spreadsheets built by one person, updated never, and trusted right up until someone notices the yield figure is two years stale. Cost-to-serve only works as a living system: reconciled yields flowing in from packaging runs, real freight and channel data from finance, returns tracked with an actual owner rather than absorbed into a mystery overhead line.
This is where connecting your production, packaging, and distribution records into one place pays off. When per-batch yield, run labor, freight, and channel returns already live in the same operational system instead of five disconnected spreadsheets, the cost-to-serve model can update from real data rather than someone's best memory of what happened last quarter. The framework is the thinking; keeping the inputs clean and connected is what makes it dependable over time.
Start with the SKUs you suspect are underperforming. Load the full stack — material, honest yield loss, real packaging labor, freight by channel, and returns. You'll almost certainly find that a couple of your busiest products are your worst performers, and a couple of quieter ones are carrying more weight than anyone realized. That reordering of what you thought you knew is the entire point.
Start with the SKUs you suspect are underperforming and keep the inputs current. When reconciled yields, real labor, freight, and returns feed a living cost-to-serve model, the math stops lying and you get actionable decisions instead of guesses.
Ready to elevate your brewery operations?
Join 500+ craft breweries using Beeryly to increase production efficiency, reduce waste, and grow sales.