
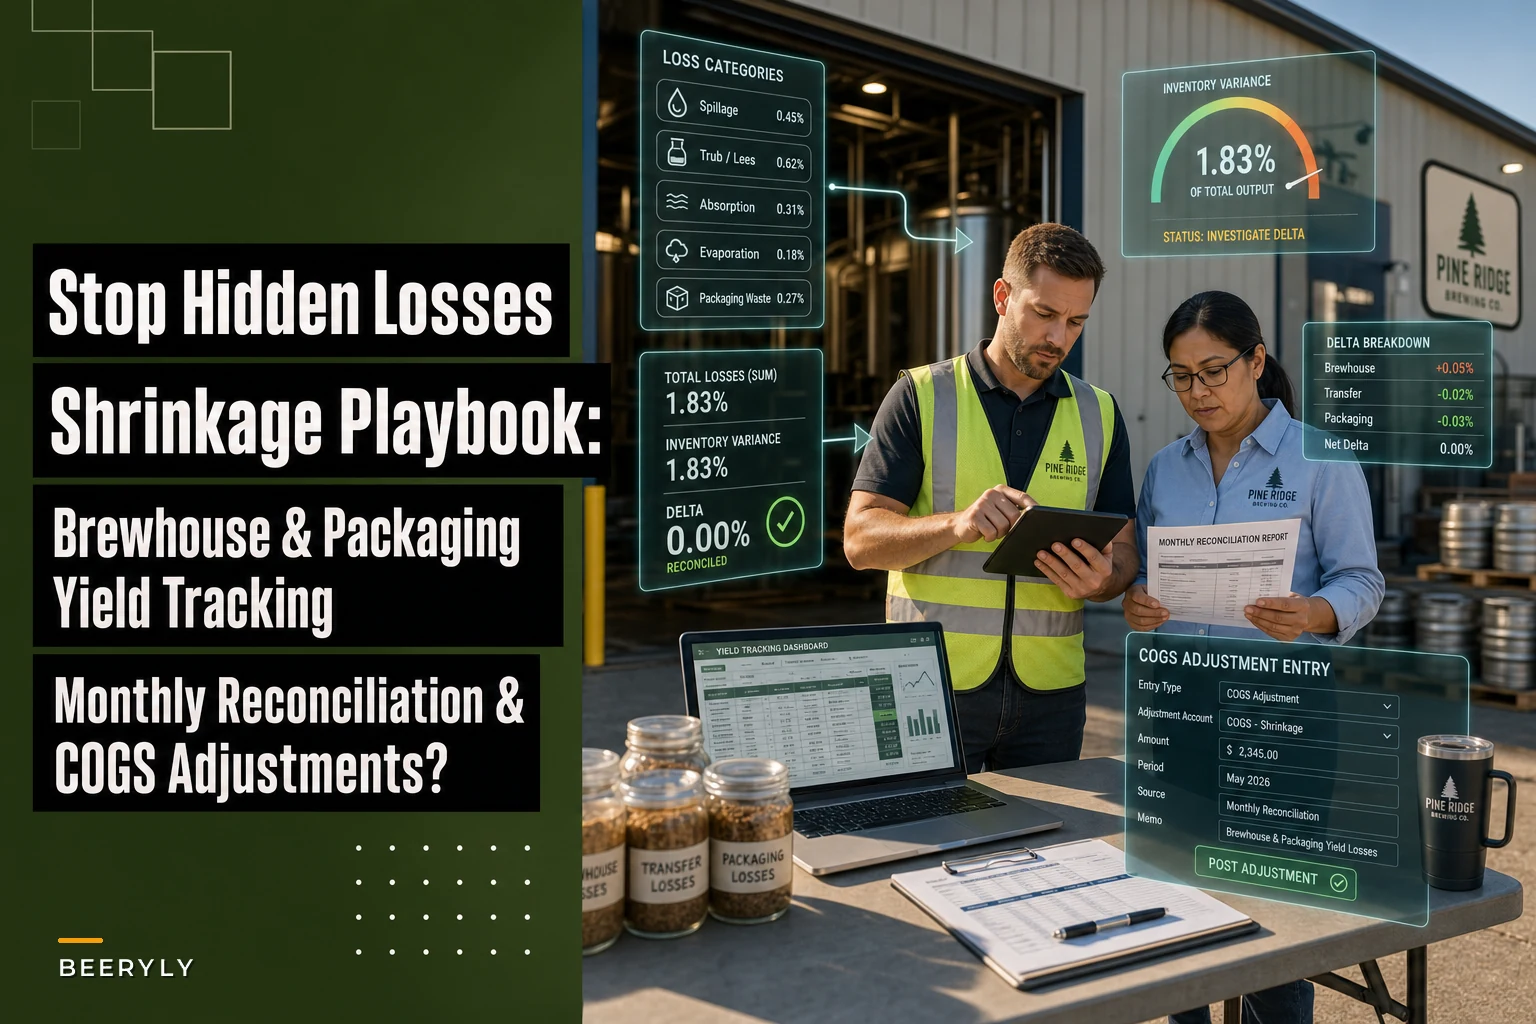

Most breweries can tell you their mash efficiency. Very few can tell you, with any real confidence, how many finished barrels they should have produced from a given batch versus how many actually made it onto a truck. The gap between those two numbers is where real money lives, and it's almost always buried somewhere between the brewhouse and the palletizer — spread across five or six handoffs that nobody's measuring individually.
That's the trap. When you only capture yield at the start (kettle volume) and the end (packaged units), every loss in between collapses into one fuzzy number you can't act on. You know you "lost some beer," but you can't say whether it went to tank bottoms, a trub-heavy transfer, foamy fills, or a leaky connection on the bright tank. So nothing changes, and the same losses repeat batch after batch.
This post is about fixing that one problem: making yield loss visible at each handoff, categorizing it in a way that actually points to something actionable, and tying the monthly total back to your books so it stops hiding inside a vague COGS line.
Why single-point measurement hides the losses that matter
The core issue with measuring yield only at the endpoints: say you brew a batch targeting 30 BBL in the kettle and you package 26.4 BBL. That's a 12% loss. Fine. But "12% loss" is useless as an operating number, because it's actually six or seven different losses stacked together, each with a completely different cause and fix.
In real operations, the loss breakdown for that same batch usually looks something like this:
-
Kettle to fermenter transfer
~0.6 BBL (trub, hose dead-legs)
-
Fermentation/yeast harvest
~1.2 BBL (yeast cake, dry-hop absorption)
-
Fermenter to bright tank
~0.5 BBL (tank heel, transfer line)
-
Bright tank conditioning/fining losses
~0.4 BBL
-
Bright to packaging line
~0.3 BBL (line priming, flush)
-
Packaging fills and rejects
~0.6 BBL (foaming, underfills, QC pulls)
Add those up and you get your 3.6 BBL. But notice: the dry-hop absorption on a heavily hopped IPA is a known, unavoidable loss you should be planning for, while the 0.6 BBL in packaging rejects might be a fixable fill-head problem costing you thousands a year. Lumped together, they look identical. Measured separately, one is a cost of doing business and the other is a project.
The pattern that keeps coming up is breweries chasing the wrong loss — spending a weekend re-plumbing a transfer line that saves 0.2 BBL per batch, while ignoring a packaging line dumping twice that every run because "that's just how canning is."
What to measure at each handoff
The fix starts with treating every transfer as a measurement point, not just a task. You need a before-volume and an after-volume at each stage, and equipment to get them reasonably accurately. You don't need lab-grade precision — you need consistent measurement so the trend is real.
Take control of your brewery’s workflow.
Beeryly helps you schedule batches, track inventory, and monitor sales with ease.
- Production timeline management
- Inventory tracking & alerts
- Sales & distribution monitoring
No credit card required
Here's the minimum worth capturing at each handoff:
| Handoff | Measure before | Measure after | Primary loss category |
|---|---|---|---|
| Kettle → Fermenter | Kettle volume (post-boil, temp-corrected) | Fermenter fill volume | Trub / transfer |
| Fermentation → harvest | Fermenter fill | Post-harvest volume | Yeast / dry-hop absorption |
| Fermenter → Bright | Pre-transfer volume | Bright tank received | Tank heel / line loss |
| Bright → Packaging | Bright tank start | Volume at line infeed | Conditioning / fining |
| Packaging run | Line infeed volume | Good units packaged | Fills / rejects / flush |
Pick and record a single reference temperature for all volume readings.
A few practical notes from how this plays out on the floor:
Temperature-correct your kettle reading. Hot wort reads higher. If you log post-boil volume at 210°F and compare it to cold fermenter volume, you'll manufacture a phantom 4% loss and chase a problem that doesn't exist. Pick a reference temp and stick to it.
Measure the bright tank heel, don't estimate it. Tank heels are one of the most consistently under-measured losses in the building. Everyone "knows" roughly what they leave behind, and everyone is a little wrong, every time. A quick sight-glass or flow-meter reading at the end of each transfer turns a guess into data.
Count packaging rejects by reason, not just quantity. A can rejected for a low fill is a different problem than one rejected for a seam defect. If your packaging log just says "42 cans scrapped," you've recorded the loss but destroyed the information that tells you why.
Simple loss-categorization rules
What makes a yield system actually usable is a tight, boring set of categories that anyone on shift can apply in two seconds. The mistake is building a 25-category taxonomy that's technically perfect and never gets filled out correctly because nobody remembers which bucket a foamy fill goes in.
Keep it to a handful of categories and write one-line rules for each:
-
Expected process loss — losses you plan for and can't reasonably eliminate (yeast cake, dry-hop absorption, unavoidable trub). Rule: if it's inherent to the recipe or process and predictable within ±20%, it's expected.
-
Transfer loss — anything left in hoses, dead-legs, pumps, or tank heels during a move. Rule: if beer physically stayed behind in equipment during a transfer, it's transfer.
-
Packaging loss — fills, foaming, line flush/priming, and rejected units. Rule: anything lost from line infeed to good packaged unit.
-
Quality loss — QC holds, dumps, off-spec batches, contamination. Rule: beer that was fine volume-wise but couldn't be sold.
-
Unaccounted — the gap between what your measurements explain and the actual total. Rule: if you can't assign it, it's unaccounted — and this number should shrink over time.
That last category is the one to watch. A high "unaccounted" number isn't a failure — it's a signal that your measurement points aren't tight enough yet. When a brewery shows 4% unaccounted loss, that's usually a missing measurement somewhere, not actual lost beer. The goal is to drive unaccounted down toward 1% or less by adding measurement where the mystery is.
A yield-report template you'll actually fill out
The report has to be short enough to complete per batch without slowing anyone down. Anything that takes more than a couple minutes gets skipped on busy days, and a yield system with gaps is barely better than no system.
Batch header: batch number, recipe/SKU, brew date, target kettle volume.
Per-handoff rows: stage, volume in, volume out, loss (auto-calculated), loss %, category, one-line note.
Batch summary: total loss BBL, total loss %, unaccounted BBL, expected vs. actual against the recipe's historical baseline.
The single most valuable field is the note, and it's the one most people skip. "Transfer loss 0.7 BBL — pump cavitated, had to re-prime" is worth ten times a bare number, because three weeks later when you're doing root-cause work, that note is the thread you pull. A yield report that's all numbers and no context tells you that you're losing beer but never why.
Pair the per-batch report with the KPIs you're already tracking. If you've built out your operational dashboard, yield-by-category feeds naturally into the same system you'd use for the KPIs that predict production problems — a rising transfer-loss trend is often an early warning of a pump or gasket starting to fail, long before it shows up as a breakdown.
Quick root-cause drills
Once you've got a few weeks of categorized data, the analysis doesn't need to be complicated. Most yield problems resolve with three simple drills you can run in under fifteen minutes.
Drill 1 — The repeat-offender scan. Sort your batches by loss % within each category. Skip the worst single batch — that's usually a one-off (a stuck valve, a spill). Look for the category that's consistently high across many batches. Consistent beats dramatic. A packaging loss sitting at 2.5% on every single run is a bigger prize than one batch that dumped 6% because someone forgot to close a valve.
Drill 2 — The SKU split. Break losses out by recipe. Hazy IPAs with heavy dry-hopping will show high harvest/absorption loss, and that's expected. But if your flagship lager — no dry-hop, clean yeast — is showing the same absorption-bucket loss, something's miscategorized or something's wrong. Comparing a loss against the right baseline for that SKU is what separates signal from noise.
Drill 3 — The five-why on unaccounted. Take your biggest unaccounted gap from the month and walk it backward. Where's the last point you had a trustworthy measurement? What happened between there and the next one? Usually the answer is a missing reading, and the fix is a new measurement point rather than an equipment change.
These drills work because they're cheap and repeatable. The breweries that actually reduce yield loss aren't doing deep statistical analysis — they're running the same boring scan every month until the repeat offenders get fixed one by one.
Monthly reconciliation tied to COGS
This is the part that turns yield tracking from a production curiosity into a financial control. At month end, you reconcile your summed yield losses against the inventory and COGS picture. The point is to make sure the beer you think you lost in production matches the beer that's actually missing from your books.
The reconciliation workflow runs like this:
-
Sum categorized losses across all batches for the month, in BBL and in dollar terms (use your per-BBL cost, not sale price — this is a cost adjustment).
-
Compare against the inventory variance. Your inventory system should show a gap between theoretical finished goods (based on batches brewed) and actual counted finished goods. These two numbers should roughly agree.
-
Investigate the delta. If production says you lost 14 BBL but inventory variance says 19 BBL, you've got 5 BBL unaccounted for somewhere outside your handoff measurements — possibly taproom pours, samples, giveaways, or a counting error.
-
Post the COGS adjustment. The loss gets booked where it belongs, and now your margin per SKU reflects reality instead of an optimistic theoretical yield.
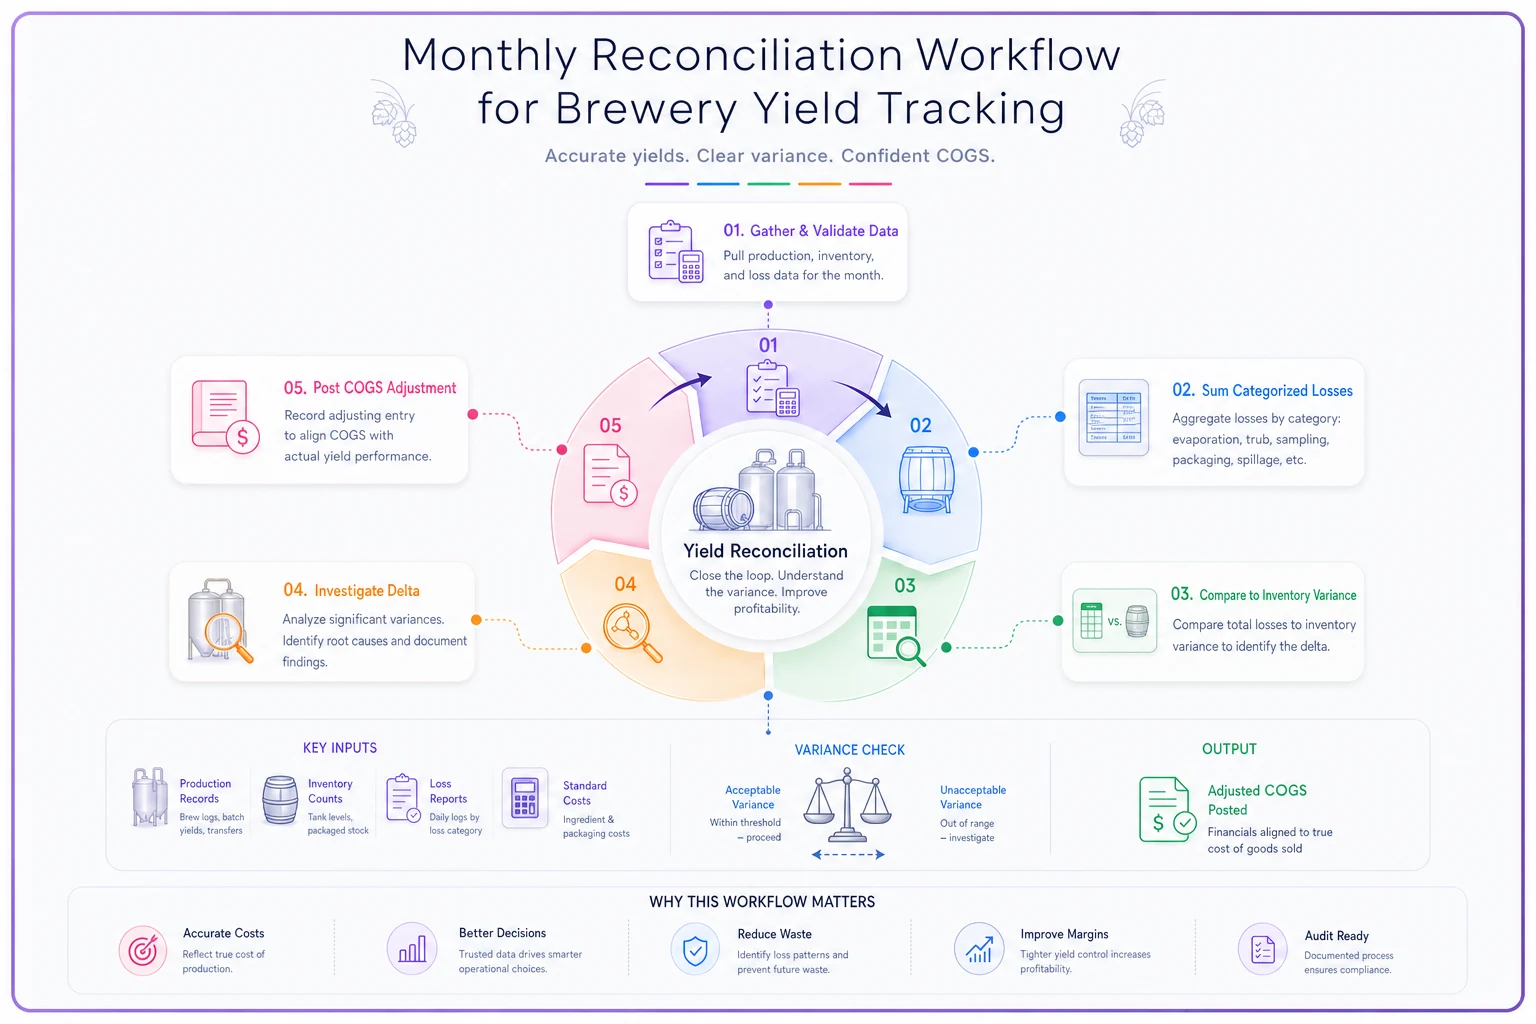
Use a simple flowchart to visualize the steps so finance and production agree on the adjustments.
Here's what most small breweries miss: expected process losses should be baked into your standard cost per SKU, and only the abnormal losses should hit as a variance. If your lager's standard cost assumes 100% yield and you're always losing 8%, your margins look great on paper and then mysteriously disappear at year-end. Build the expected loss into the standard, and your variance line only lights up when something's actually wrong.
This connects to inventory health too. A lot of what looks like yield loss on paper is actually spoilage and working-capital leakage — beer that aged out, got dumped, or sat too long in a bright tank. Keeping those categories separate in your reporting matters, because the fix for spoilage (better scheduling, FIFO discipline) is completely different from the fix for transfer loss (equipment and procedure).
A real scenario
A roughly 4,000 BBL/year production brewery in the Midwest was running what they assumed was a normal 9–10% total loss. No per-handoff tracking — just kettle volume in, packaged units out. Their accountant had flagged that actual margins were running a few points below the model, and nobody could explain where.
They set up handoff measurements with a cheap flow meter on transfers and a reject-by-reason tally sheet on the canning line. First month of real data: total loss was closer to 11.5%, and the surprise was where. Everyone assumed the brewhouse was the problem. It wasn't. Packaging was bleeding around 3.2% — mostly foaming underfills from a fill-head pressure issue nobody had quantified, plus line flush volumes larger than necessary.
The fix was unglamorous: a fill-head adjustment, a tighter CO2 counter-pressure setting, and trimming the line-flush procedure. Over the next quarter, packaging loss dropped to around 1.8%. On their volume, that recovered somewhere in the range of 50–60 BBL a year — call it close to $9k–$11k in product cost that had simply been evaporating into an untracked bucket. The brewhouse "problem" everyone assumed they had turned out to be mostly expected process loss that was fine the whole time.
The real win wasn't the dollars, though those helped. It was that for the first time they could look at a number and know what to do about it.
When this is worth it — and when it isn't
A full handoff-level yield system makes sense once you're brewing consistently enough that repeat losses are costing real money — generally once you're past the very small nano stage and running regular production batches. If you're doing a handful of batches a month, the measurement discipline is still useful but you can keep it simpler, maybe just tracking kettle-to-fermenter and packaging separately.
Where it goes sideways is trying to implement all of it at once. Breweries that roll out a ten-column yield sheet across every handoff on day one usually abandon it within a month because the data entry overwhelms a short-staffed cellar crew. Start with your two most suspicious handoffs — usually packaging and your biggest transfer loss point — get clean data there, then expand.
And if your fundamental measurements aren't trustworthy yet — inconsistent kettle readings, no temperature correction, eyeballed tank heels — fix that first. A precise-looking yield report built on sloppy inputs just gives you confident wrong answers, which is worse than knowing you don't know.
Yield loss hides because most breweries measure it in one lump at the endpoints, where every different problem looks the same. Break the measurement into handoffs, categorize losses with a few simple rules anyone can apply, run the monthly drills, and reconcile the total back to COGS so expected losses live in your standard cost and only real problems show up as variance.
The breweries that get this right aren't running sophisticated analytics. They're measuring at each handoff consistently, writing down why when something looks off, and fixing one repeat offender at a time. Do that for a few months and the fuzzy "we lose about 10%" turns into a short list of specific, fixable problems — and the beer stops quietly disappearing between the kettle and the truck.
Ready to elevate your brewery operations?
Join 500+ craft breweries using Beeryly to increase production efficiency, reduce waste, and grow sales.