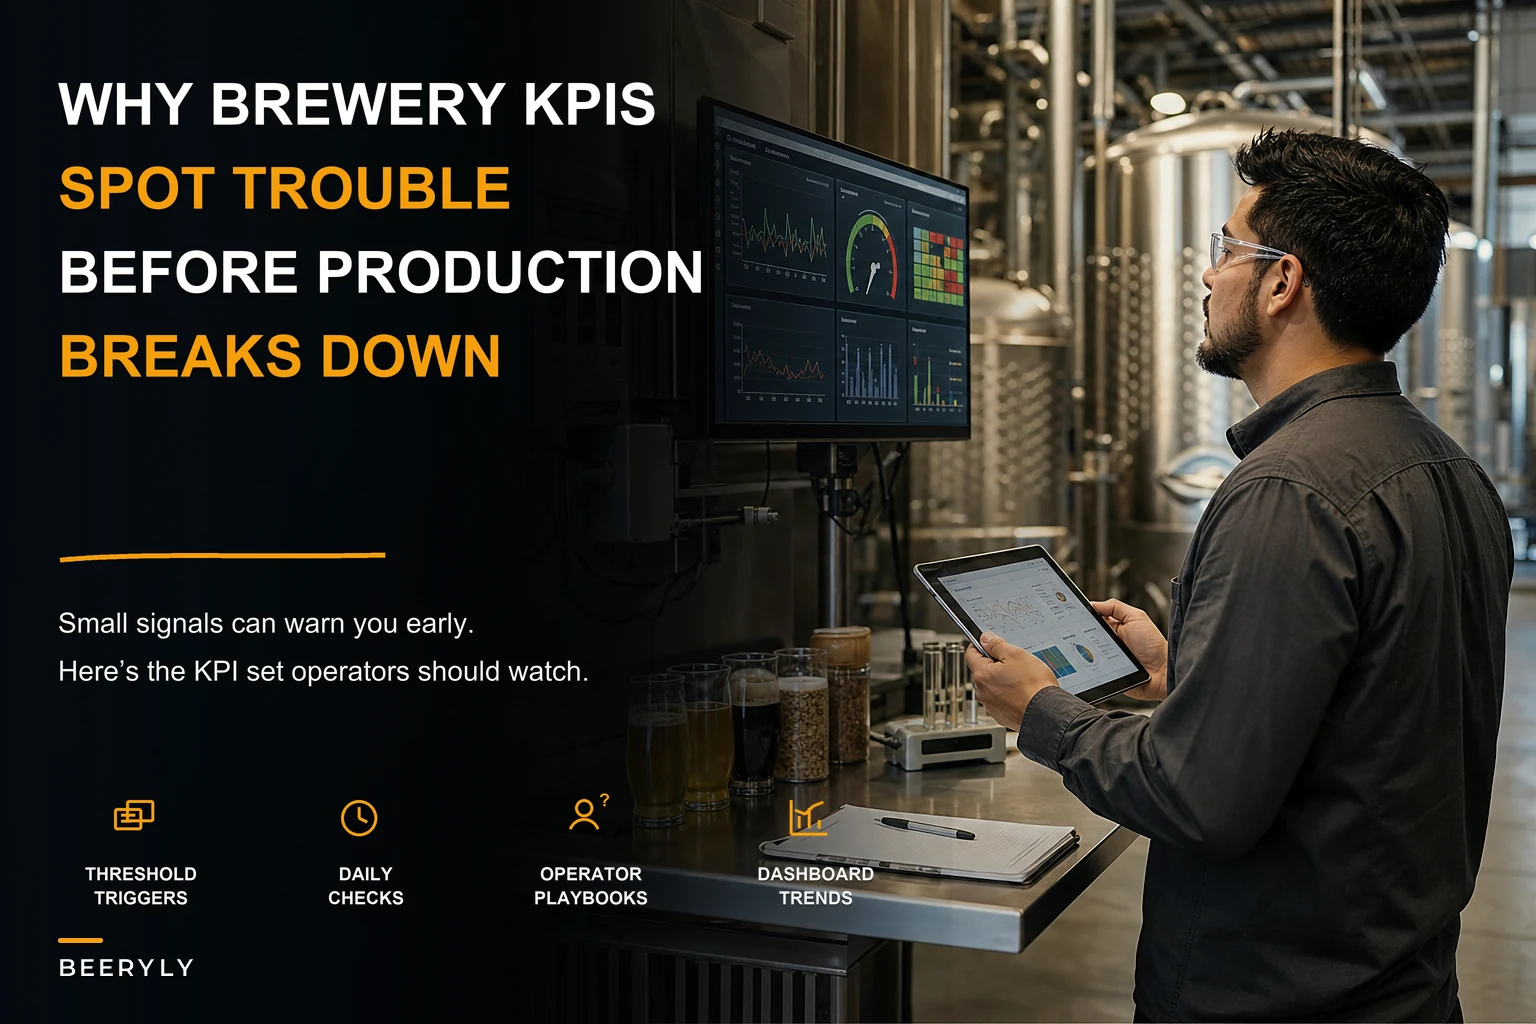

Running a brewery means running three businesses at once—a factory, a chemistry lab, and a hospitality venue. Most brewery owners track revenue and check tank turns monthly, but the operations that prevent costly disasters live in a handful of KPIs that almost nobody monitors correctly.
Building operational software for dozens of craft breweries showed me the same pattern: production problems appear in the numbers weeks before they become expensive emergencies. The difference between breweries that catch issues early and those that don't? They track the right KPIs with actual trigger thresholds and know exactly what to do when those numbers shift.
Why standard brewery metrics miss operational problems
Most brewery dashboards show vanity metrics. Total barrels produced, revenue per month, maybe some basic cost percentages. These tell you what already happened, not what's about to break.
Real production problems hide in the gaps between your systems. A slight uptick in dissolved oxygen readings combined with slower tank turns might mean nothing individually. Together, they predict batch failures two weeks out. Your yeast cell counts look fine in isolation, but paired with fermentation variance data, they reveal contamination risks before they spoil 30 barrels.
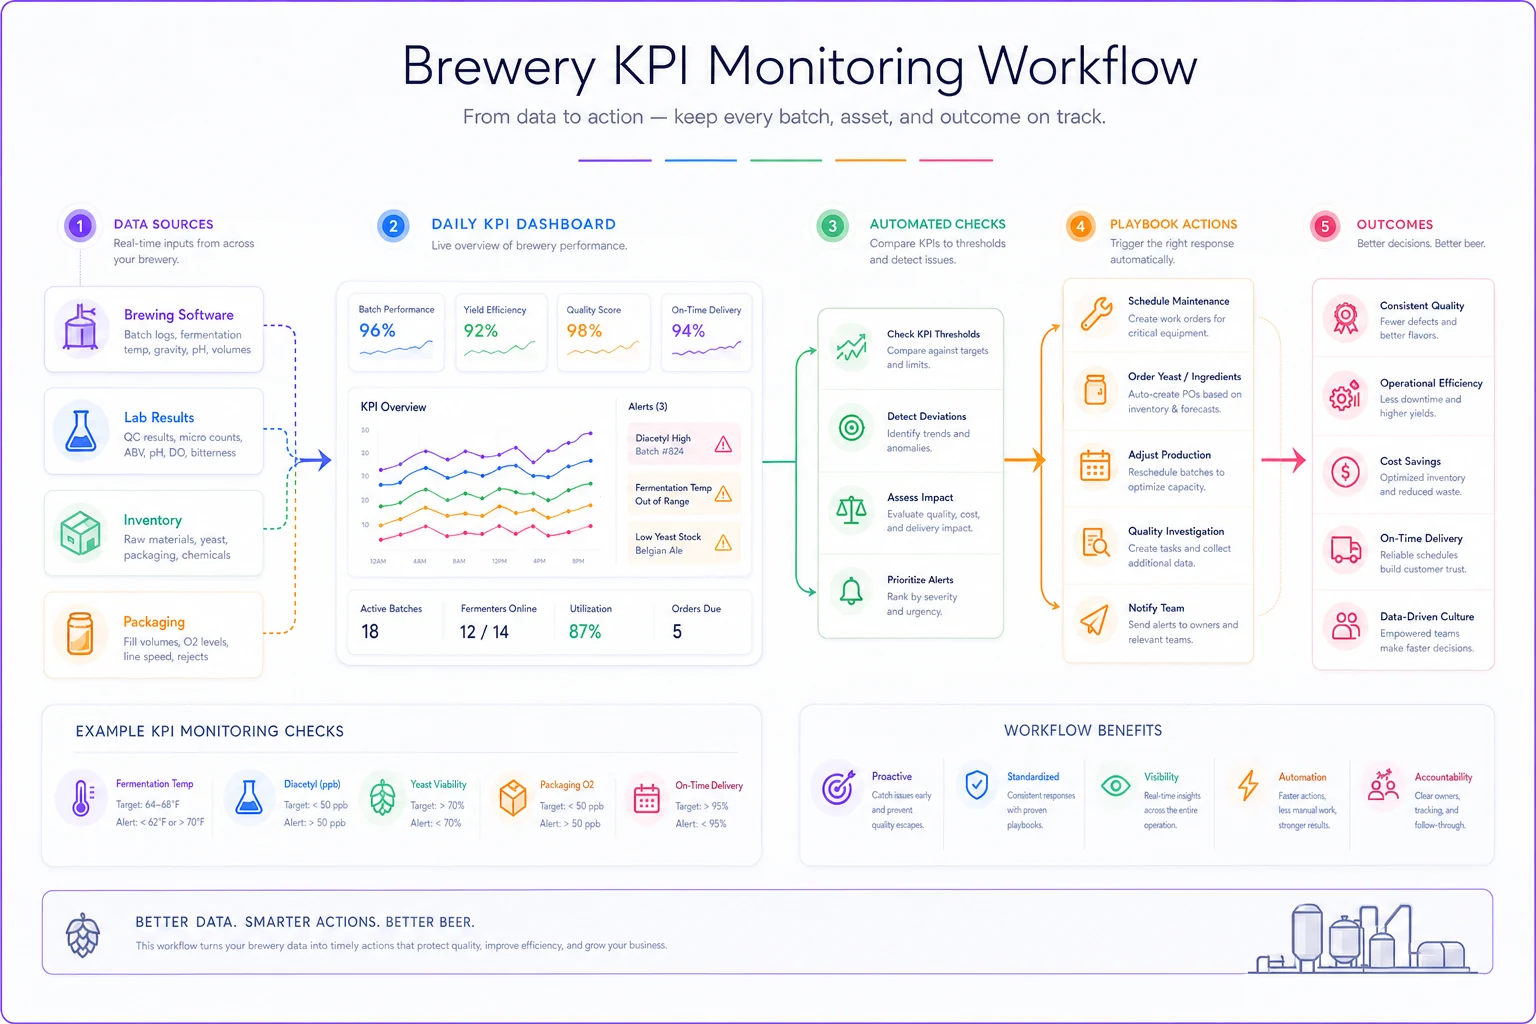
Breweries that avoid major production disasters track operational relationships, not isolated numbers. They build dashboards that connect quality control data to production schedules to inventory turnover. When multiple KPIs shift together, even slightly, they have specific playbooks ready.
The real issue is that most breweries collect tons of data but don't connect the dots. You've got brewing software tracking tank temperatures, lab software recording test results, and spreadsheets tracking inventory. But none of them talk to each other, so patterns get missed.
The core KPI framework that catches problems early
Tank utilization efficiency
Take control of your brewery’s workflow.
Beeryly helps you schedule batches, track inventory, and monitor sales with ease.
- Production timeline management
- Inventory tracking & alerts
- Sales & distribution monitoring
No credit card required
Formula:
``
(Days in primary + Days in secondary) / Total available tank days × 100
``
Dashboard visualization: Heat map showing each tank's utilization over 30 days, with red zones above 85% and below 60%.
-
Below 60%
Capacity waste, scheduling problems
-
Above 85%
Bottleneck forming, quality risk
-
Variance >15% between tanks
Flow imbalance
Action playbook when below 60%:
Check your production schedule first. Are you batching similar styles together? Small breweries often leave tanks empty because they're waiting for ingredients or trying to time releases perfectly. Map out your next 6 weeks of production and identify where you can double-batch popular styles or brew ahead for seasonal releases.
Review your CIP scheduling. Sometimes tanks sit empty because cleaning cycles don't align with brewing schedules. Consider adjusting your brew days to create natural CIP windows.
| Threshold | Meaning |
|---|---|
| Below 60% | Capacity waste, scheduling problems |
| Above 85% | Bottleneck forming, quality risk |
| Variance >15% between tanks | Flow imbalance |
Dissolved oxygen variance
Formula:
``
(Max DO reading - Min DO reading) / Average DO × 100
``
Measure at three points: post-filtration, at packaging, and 24 hours post-package.
Dashboard visualization: Line graph showing DO levels at each measurement point across batches, with control limits at ±20% from target.
-
Variance >25%
Equipment calibration issues
-
Upward trend over 5 batches
Seal degradation
-
Spike at specific measurement point
Process breakdown
Action playbook for variance >25%:
Start with your measurement equipment. When was your DO meter last calibrated? Check the membrane condition—they degrade faster in high-alcohol environments.
Audit your transfer process. Watch one complete transfer from fermentation to packaging. Look for foam, turbulence, or any point where beer contacts air. Even small leaks in gaskets spike DO readings.
Review your purge procedures. Most DO problems come from incomplete purging, not actual oxygen pickup during transfer. Calculate your purge volumes—you need 3-5 tank volumes of CO2 for complete oxygen displacement.
Yeast generation tracking
Formula:
``
(Current generation viability × Cell count) / (Original pitch viability × Cell count) × 100
``
Track per strain with full genealogy records.
Dashboard visualization: Genealogy tree showing each generation's performance metrics with color coding for viability drops.
-
Generation health <85%
Re-pitch decision point
-
Viability drop >10% between generations
Contamination risk
-
Attenuation variance >5%
Mutation concerns
Action playbook for generation health <85%:
Stop using that generation immediately for flagship beers. You can still use it for limited releases where slight flavor variations won't matter, but order fresh yeast now.
Test for bacterial contamination—a sudden viability drop usually means infection, not natural degradation. Run a forced fermentation test on a sample.
Review your harvesting technique. Are you pulling from the cone at the right time? Too early gets trub, too late gets dead cells. The sweet spot is 12-24 hours after fermentation completes.
Production schedule variance
Formula:
``
(Actual brew completion time - Scheduled completion time) / Scheduled time × 100
``
Calculate for each major production step.
Dashboard visualization: Gantt chart showing scheduled vs actual times with variance percentages and cascading delay impacts.
-
Single batch >20% over time
Process problem
-
Average variance >10%
Systemic scheduling issues
-
Increasing trend
Capacity planning needed
Action playbook for average variance >10%:
Your schedules are fiction. Start tracking where delays actually happen. Is it always the same tank? Same brew day? Same employee?
Build buffer time into your schedules. A packed schedule with no slack falls apart after one delayed CIP or stuck mash. Add 15% buffer time between major operations.
Create a delay log. Every time something runs late, write down why. After a month, you'll see patterns—maybe your mill needs maintenance, or grain delivery consistently arrives late on Tuesdays.
Quality control KPIs that prevent batch disasters
Sensory panel consensus score
Formula:
``
(Number of "pass" ratings / Total panel ratings) × 100
``
Run panels on every 10th batch minimum, every batch for new recipes.
Dashboard visualization: Control chart showing consensus scores over time with upper and lower control limits based on historical data.
-
Score <75%
Hold for investigation
-
Downward trend over 3 batches
Process drift
-
Sudden drop >15%
Contamination or equipment failure
Action playbook for score <75%:
Don't release that batch. Pull samples from multiple points in the tank and re-test. If scores stay low, you've got options: blend it with a stronger batch, use it for a limited "experimental" release, or bite the bullet and dump it.
Check your raw materials. Did you switch suppliers recently? Even small changes in malt characteristics affect flavor. Pull samples of your grain and hops for evaluation.
Review your process logs for that batch. Look for temperature excursions, extended transfer times, anything unusual. Small process variations compound into flavor problems.
Microbiological trending
Formula:
``
Current week's positive tests / Rolling 4-week average
``
Test at five points: incoming water, post-boil, post-fermentation, packaging, and random environmental swabs.
Dashboard visualization: Multi-line trend showing each test point's contamination rate with alert zones above historical baselines.
-
Any packaging positive
Stop production
-
Environmental rate >2x average
Deep clean needed
-
Pattern at specific point
Equipment issue
Action playbook for environmental rate >2x average:
Your brewery is getting dirty. Schedule a full brewery shutdown for deep cleaning within 48 hours. Every day you wait increases contamination risk exponentially.
Review your cleaning chemical concentrations. Caustic and sanitizer lose effectiveness over time. When did you last change your chemical drums? Test your solutions—you need 2-3% caustic and 200ppm sanitizer minimum.
Check your air handling. Positive pressure keeps wild yeast out. If you're running exhaust fans without make-up air, you're sucking in contamination.
Inventory and financial KPIs that reveal hidden problems
Working capital cycle time
Formula:
``
(Raw material days + WIP days + Finished goods days) - Payables days
``
Calculate monthly with trending analysis.
Dashboard visualization: Waterfall chart showing each component's contribution to total cycle time with period-over-period changes.
-
Cycle >45 days
Cash flow risk
-
Increase >7 days month-over-month
Investigate immediately
-
Component imbalance
Operational inefficiency
Action playbook for cycle >45 days:
You're financing your distributors' business. Start with accounts receivable—who owes you money and for how long? Call anyone over 30 days today.
Negotiate payment terms with suppliers. Many will give you 45-60 day terms if you ask. Even an extra 15 days helps cash flow significantly.
Look at your finished goods inventory. Are you producing too far ahead of demand? Every day beer sits in your cooler costs money. Adjust batch sizes to match actual sales velocity.
Package mix profitability
Formula:
``
(Gross margin per package type × Volume) / Total packaged volume
``
Track for kegs, cans, bottles, and crowlers separately.
Dashboard visualization: Stacked bar chart showing margin contribution by package type with volume overlay.
-
Any format <20% margin
Pricing problem
-
Mix shift >10% to lower margin
Strategy review needed
-
Declining trend any format
Cost investigation
Action playbook for format <20% margin:
Stop producing that format for distribution immediately. You might keep it for taproom sales where margins are higher, but wholesale needs higher margins to be sustainable.
Recalculate your true packaging costs. Include labor, materials, equipment depreciation, and quality holds. Most breweries underestimate packaging costs by 30-40%.
Consider co-packing for low-margin formats. If canning kills your margins but you need cans for retail, find a mobile canner or partner brewery. The per-unit cost might be higher, but eliminating equipment and labor costs often improves net margin.
The cascade effect: how KPI relationships predict failures
KPIs never move in isolation in a brewery. When tank utilization creeps up, DO variance usually follows within two weeks. High yeast generations correlate with sensory score drops. Understanding these relationships helps you prevent problems, not just react to them.
A 7-barrel brewery noticed their tank utilization hit 82%. Instead of celebrating the efficiency, they checked their related KPIs. DO variance was trending up slightly, and yeast was on generation 8. They immediately ordered fresh yeast, scheduled tank maintenance, and adjusted their production schedule to build in buffer time. This prevented what would have been three contaminated batches two weeks later.
The magic happens when you build these relationships into your monitoring. When tank utilization exceeds 80%, automatically flag DO and yeast metrics for daily monitoring. When sensory scores drop, immediately check micro counts and DO variance. These connections catch problems while they're still cheap to fix.
Most breweries track individual metrics in silos. Production data lives in one system, quality data in another, financial data in spreadsheets. But the real insights happen where these systems intersect.
Building your monitoring system without drowning in data
Start with five KPIs maximum. Pick the ones that have cost you money in the past year. If you've had contamination issues, start with micro trending and DO variance. If cash flow keeps you up at night, focus on working capital cycle and tank utilization.
Set up a simple daily dashboard. It doesn't need to be fancy—a spreadsheet works fine initially. The key is actually checking it every morning and having clear action triggers. When a KPI hits a threshold, you execute the playbook, period. No waiting to see if it improves, no hoping it's a measurement error.
Weekly, review KPI relationships. Plot your metrics on the same graph and look for patterns. Do certain KPIs always move together? Does one consistently predict another? These patterns become your early warning system.
Start with KPIs that have hit you in the past year—it's the fastest path to useful alerts.
Monthly, adjust your thresholds based on actual performance. Your initial thresholds will be wrong—that's fine. As you collect data, you'll identify the real trigger points for your specific operation. A threshold that works for a 7-barrel brewery won't work for a 30-barrel operation.
The biggest mistake breweries make is trying to track everything at once. You end up with dashboard paralysis—too much data, too many alerts, no clear priorities. Start small and expand gradually.
Software automation for proactive monitoring
Modern brewery operations software can track these KPIs automatically, pulling data from your brewing software, lab systems, and even manual entries. The real value isn't in the data collection—it's in the pattern recognition and automatic alerting.
AI-powered platforms now identify KPI relationships you might miss. They'll notice that your DO variance spikes whenever a specific employee runs transfers, or that certain grain lots correlate with sensory score drops. These insights come from analyzing patterns across hundreds of batches, something impossible to do manually.
The best systems also maintain your playbooks digitally, automatically assigning tasks when KPIs hit thresholds. When tank utilization exceeds 80%, the system schedules maintenance checks, orders yeast, and adjusts production schedules automatically. This removes the delay between problem identification and action.
Automation works best when it handles the routine monitoring and alerts, freeing up your team to focus on problem-solving and process improvement. The goal isn't to replace human judgment, but to ensure nothing slips through the cracks during busy periods.
The difference between surviving and scaling
Breweries that scale successfully treat their KPIs like a nervous system—constantly sensing, quickly responding, always learning. They know their operation's vital signs so well that they spot problems before they become expensive.
This framework isn't about perfection. Your brewery will have unique challenges that require different KPIs or thresholds. But the principle remains: measure relationships, not just numbers. Set clear triggers, not vague guidelines. Have specific playbooks, not general responses.
Most production disasters aren't surprises—they're visible in the data weeks before they explode. The difference between breweries that catch them and those that don't comes down to knowing which numbers matter and what to do when they change.
Start with one KPI this week. Calculate it, set a threshold, write a playbook. Then add another. Within three months, you'll prevent problems that would have cost thousands. More importantly, you'll sleep better knowing your operation has an early warning system that actually works.
Ready to elevate your brewery operations?
Join 500+ craft breweries using Beeryly to increase production efficiency, reduce waste, and grow sales.