


Most breweries don't lose money on equipment the day it breaks. They lose it slowly, in the eighteen months before it breaks, while everyone argues about whether the chiller is "basically fine" and the packaging line keeps throwing minor faults that nobody logs. Then a glycol pump seizes during a canning run, you dump half a batch, and suddenly the conversation about replacing a $14k compressor happens under the worst possible conditions — reactive, rushed, and expensive.
The whole point of brewery asset lifecycle economics is to move that decision upstream, where you have options and leverage instead of a crisis and a quote. This isn't about spreadsheets for their own sake. It's about knowing, for each major asset, roughly where you are on the curve and what the smart next move costs.
The two assets that quietly dictate your production reliability: the packaging line and the chillers. Everything else follows from how well you manage those two.
Why these two assets drive everything else
Your fermenters can sit. Your brite tanks can wait a day. But a chiller failure cascades into fermentation temperature control, cold crash timing, and cold-side quality all at once. A packaging line fault doesn't just stop packaging — it backs up finished beer that's holding tank space you needed for the next brew. These two assets sit at chokepoints, which means their downtime multiplies.
That's the first thing people get wrong when they think about replacement. They evaluate the asset in isolation — "what does a new filler cost vs. fixing this one" — instead of pricing the coordination cost of it going down. A packaging line that fails twice a quarter isn't a $3k repair problem. It's a scheduling problem, a labor-overtime problem, and sometimes a customer fill-rate problem rolled together.
The breweries with the fewest ugly surprises aren't the ones with the newest gear. They're the ones who treat each asset as a line item with a known age, a known failure pattern, and a pre-decided threshold for action.
The lifecycle curve, in plain terms
Every mechanical asset moves through roughly four economic phases. The trick is recognizing which one you're in before the asset tells you.
Take control of your brewery’s workflow.
Beeryly helps you schedule batches, track inventory, and monitor sales with ease.
- Production timeline management
- Inventory tracking & alerts
- Sales & distribution monitoring
No credit card required
| Phase | What it looks like | PM intensity | Right financial posture |
|---|---|---|---|
| Break-in | New, occasional teething faults | Light, monitor | Protect warranty, log baselines |
| Stable | Predictable, low maintenance cost | Standard PM schedule | Run it, bank the savings |
| Rising cost | Repairs creeping up, parts harder to get | Heavy, reactive creeping in | Start the refurbish-vs-replace clock |
| End-of-life | Downtime unpredictable, repair cost per hour climbing | Constant firefighting | Replace or plan a full rebuild |
The dangerous phase is "rising cost," because it feels manageable month to month. Each individual repair is justifiable. A $600 valve here, a $900 sensor there, a weekend of a tech's time. Nobody panics. But if you add it up over a trailing twelve months and compare it to the amortized cost of a replacement, the picture often flips hard.
A rough rule worth leaning on: when trailing-12-month maintenance plus downtime cost on an asset exceeds 40–50% of the annualized cost of replacing it, you're no longer maintaining — you're subsidizing a corpse. That's your signal to run the real numbers, not keep patching.
What actually breaks, and when
On packaging lines, the failure pattern is predictable enough to plan around. Fillers and seamers accumulate wear on the moving contact parts — fill valves, seaming rolls, star wheels, change parts. These are consumables masquerading as equipment. The line itself can last 12–15 years, but the parts that touch product wear out on a 2–4 year cycle depending on throughput.
Chillers fail differently. Glycol chillers degrade quietly — fouled condensers, aging compressors losing efficiency, refrigerant charge drifting. The sneaky cost isn't the failure. It's the efficiency decline that shows up as a slowly rising electricity bill nobody connects to the chiller. A unit running 15–20% less efficient than spec can quietly cost you four figures a year in extra power before it ever throws a hard fault.
A common version of this: a 20-bbl brewery notices their summer glycol temps creeping up, blames the heatwave, adds a portable spot cooler, and never investigates the fouled condenser coils that caused the whole thing. Two summers later the compressor fails during peak season. The "cheap" workaround cost more than the coil cleaning they skipped, plus the dumped batch, plus the emergency compressor premium.
The spare parts question that changes the math
This is where lifecycle economics gets practical. The refurbish-vs-replace decision is massively affected by parts availability, and most breweries don't price this in until it bites them.
Ask three questions about any aging asset:
-
Are OEM parts still manufactured, or are you on the secondary market?
-
What's the lead time on the most failure-prone part — days, weeks, or months?
-
Does a single supplier control the part, or are there alternatives?
When critical parts move to 8–12 week lead times, the economics shift dramatically toward replacement even if the asset "works fine today." A line that's down for ten weeks waiting on a discontinued part isn't an asset — it's a liability wearing a factory badge.
The counter-move is a tiered spare-parts strategy tied to failure probability:
-
Hold on-site high-failure, low-cost, long-lead parts (seals, common valves, sensors, fuses, belts). These should never cause downtime.
-
Pre-sourced, not held mid-cost parts with a known, reliable supplier and under 1-week lead. You keep the part number and vendor on a card, not the part on a shelf.
-
Replacement trigger parts expensive, long-lead, or discontinued parts. If one of these fails, that's your signal to execute a replacement plan, not a repair — because the repair cost and downtime approach replacement anyway.
Keep a one-page parts card per asset listing the highest-failure parts, their lead times, and a preferred vendor contact.
If you've already built a preventive maintenance and reliability framework, this spare-parts tiering plugs directly into it. PM tells you what to inspect; the parts strategy tells you what the inspection results should trigger.
Pricing downtime honestly
Most refurbish-vs-replace decisions fall apart because downtime gets treated as free. It isn't. Put a real number on it before you decide anything.
A workable downtime cost model for a packaging line:
-
Direct labor idle crew standing around at loaded cost (say 3–4 people on a canning line).
-
Lost production value barrels you can't package and ship this week, at margin not revenue.
-
Tank occupancy cost finished beer stuck in a brite tank blocking your next brew — this is the hidden one.
-
Expedite/overtime premium what it costs to catch back up.
-
Quality risk product sitting longer than planned, risk of oxidation or spec drift.
Run this for a realistic failure scenario. If a mid-size line goes down for a day and a half during peak season, you're often looking at a four-figure hit per incident once tank occupancy and overtime are factored in. Two or three of those a year completely rewrites whether that $45k line replacement is "expensive."
Decision thresholds: refurbish vs replace
Here's the framework stripped to thresholds you can actually apply this quarter.
Lean toward refurbish when:
-
The core structure (frame, tank, main housing) is sound and the wear is in replaceable parts.
-
Parts are available with reasonable lead times.
-
Trailing-12 maintenance cost is under ~30% of replacement cost.
-
A refurbish buys you 3+ years of stable operation.
-
Your production volume isn't about to outgrow the asset's capacity.
Lean toward replace when:
-
Repairs are clustering — the asset fails in a new way every few months.
-
Critical parts are discontinued or on long lead.
-
Trailing-12 maintenance + downtime exceeds 40–50% of replacement cost.
-
The asset is a capacity bottleneck you're already working around.
-
Efficiency decline (especially on chillers) is costing measurable money every month.
When refurbish is actively a bad idea: when you're refurbishing to avoid a capital conversation you'll be forced to have in 12 months anyway. Sinking $9k into a chiller rebuild right before you add two fermenters that will overload it is just paying twice. If a capacity expansion is on the horizon, fold the equipment decision into that plan — the capital planning readiness checklist is the right place to make that call deliberately rather than reactively.
A real scenario: the 15-bbl packaging line decision
A 15-bbl production brewery, roughly 2,800 bbl/year, running a used mono-block filler/seamer they bought at launch. Year five. The seamer started throwing intermittent seam defects — not constant, maybe one bad run in six.
What they tracked over the trailing year:
-
Seamer-related repairs and parts
around $4,200
-
Downtime
roughly three partial-day stoppages, call it ~$6k–$7k all-in once overtime and a blocked brite tank were counted twice
-
Scrapped/re-run product from seam defects
a couple thousand dollars of margin gone
Total trailing-12 cost of keeping the old line running: somewhere in the $12k–$13k range. A refurbished replacement unit with a current-generation seamer and available parts ran about $38k.
At first glance, "$13k vs $38k, keep the old one" sounds obvious. But maintenance plus downtime was already past a third of replacement cost, the seaming rolls were a discontinued spec, and the defect rate was a quality risk they couldn't fully control. They were in the rising-cost phase heading straight into end-of-life.
They replaced it. Over the following year, packaging downtime on that asset dropped to effectively zero — planned PM only. Scrap from seam defects disappeared. And the part they didn't expect: their packaging scheduling got dramatically more predictable because they stopped building slack into the calendar for "if the seamer acts up." The real win wasn't the repair savings. It was that the chokepoint stopped being a chokepoint.
The quarterly review that keeps this from becoming a crisis
The whole framework falls apart if it only comes out during emergencies. The breweries that stay ahead of this run a short, boring, recurring asset review — quarterly for major assets. It doesn't need to be elaborate:
It doesn't need to be elaborate:
-
Pull trailing-12 maintenance cost per major asset.
-
Note any failures and whether they're clustering.
-
Check critical-part lead times and availability (they drift — a part that was 2 weeks last year can be 10 weeks now).
-
Flag any asset that crossed a threshold.
-
Update the replace/refurbish posture for each.
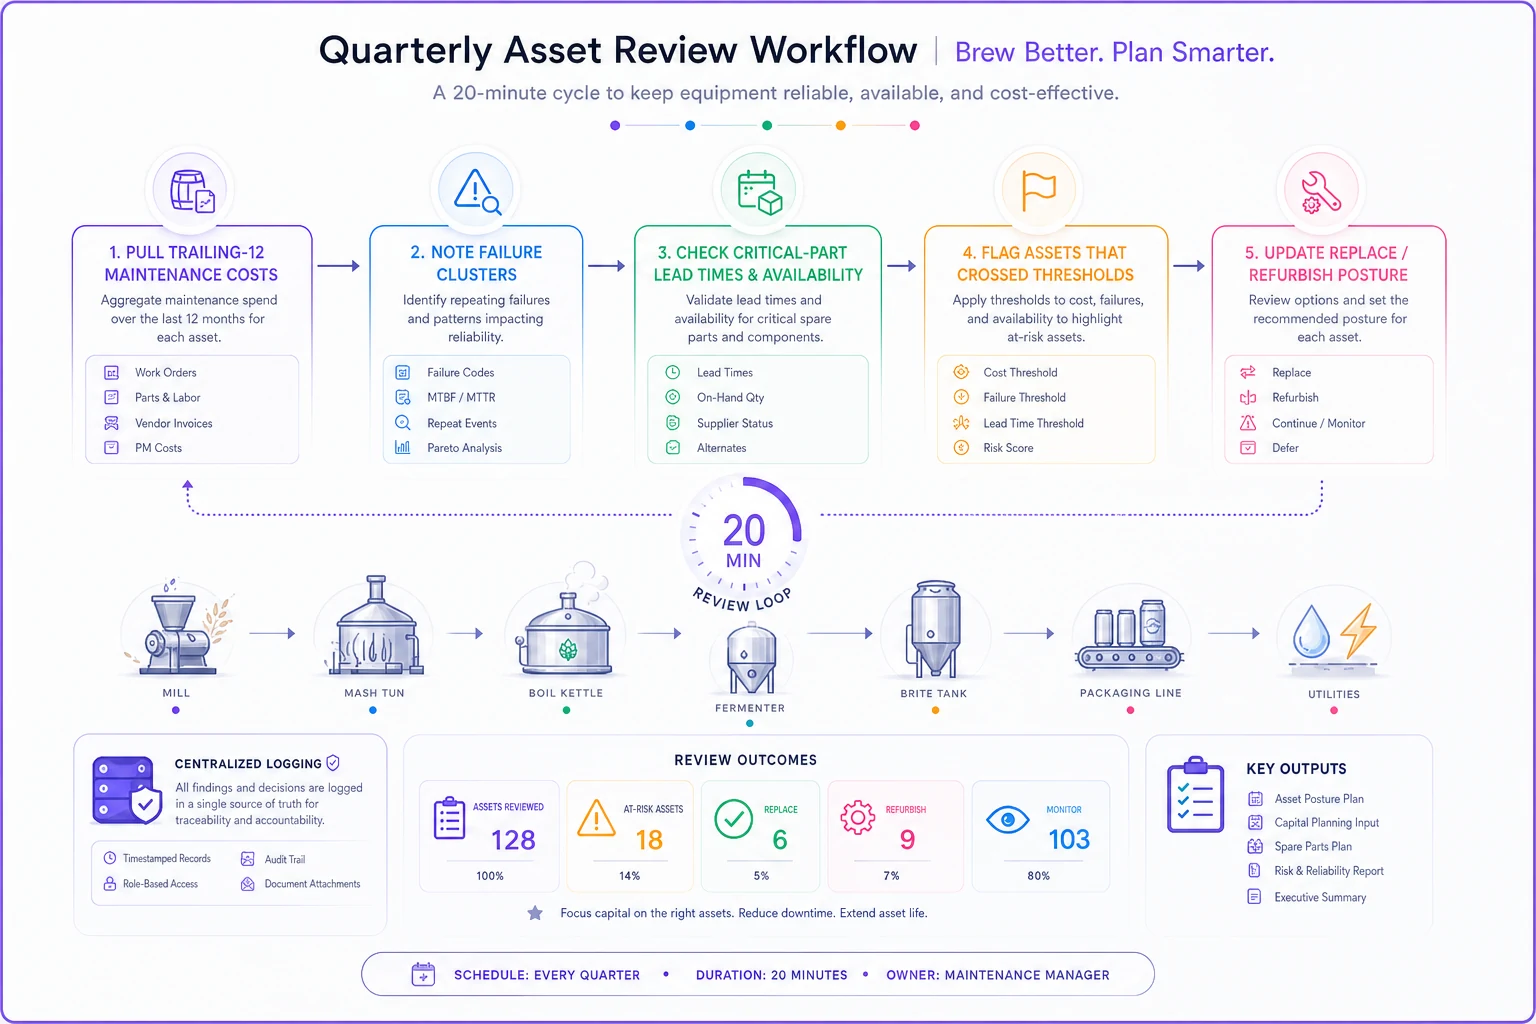
When maintenance history, failure logs, and parts data live in one place instead of scattered across a tech's memory, a wall calendar, and three email threads, this review takes twenty minutes instead of being impossible. That's the quiet value of keeping asset records centralized — not the tool itself, but the fact that the decision becomes obvious when the trailing numbers are actually visible. A system that logs failures, tracks PM, and surfaces when an asset crosses your cost thresholds turns lifecycle economics from a once-a-crisis panic into a routine operating rhythm.
Where most breweries actually go wrong
Two patterns show up consistently.
First, they let the loudest asset win attention while the quiet one bleeds. The packaging line gets all the drama because its failures are visible and immediate. The chiller degrades silently, costs more over time, and gets ignored until it fails catastrophically. Efficiency decline doesn't throw an alarm — you have to go looking for it.
Second, they treat every repair as a fresh, isolated decision instead of a data point on a curve. One repair is just a repair. Five repairs in a year on the same subsystem is a replacement signal that everyone missed because nobody was summing them up.
Asset lifecycle economics isn't complicated math. It's the discipline of keeping a running tally per asset, knowing your thresholds before you're emotional about it, and making the replace-or-refurbish call while you still have time to plan the install around your production calendar instead of scrambling in the middle of a peak-season run. Get that rhythm in place and the expensive surprises mostly stop being surprises.
Ready to elevate your brewery operations?
Join 500+ craft breweries using Beeryly to increase production efficiency, reduce waste, and grow sales.