

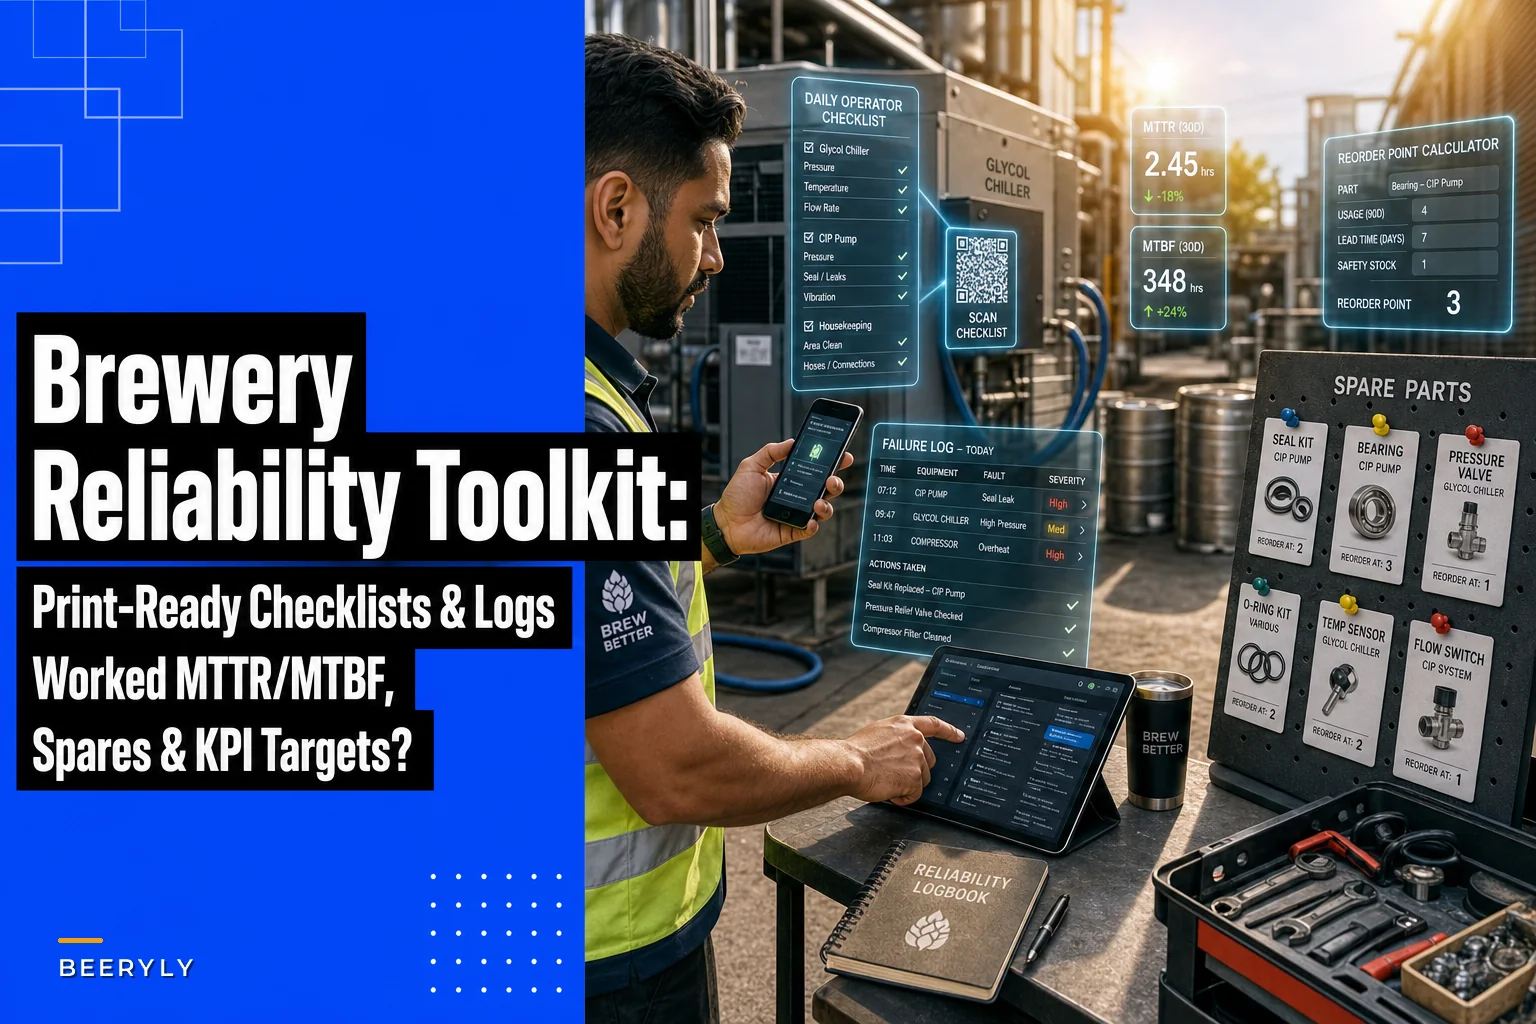

If you've already got a maintenance philosophy figured out, you don't need another explanation of why reliability matters. You need the actual paper. The checklist that goes on the clipboard by the glycol chiller. The spreadsheet columns you can paste into Google Sheets before the next shift. The reorder-point math that keeps you from discovering your last pump seal is gone at 6 a.m. during a transfer.
This is that toolkit. It's a companion to our broader framework on preventive maintenance and reliability for small breweries — so we're skipping the conceptual groundwork and going straight to the deliverables. Copy what you need. Adjust the numbers to your equipment. Print the one-pagers. One quick note on "Tier‑1" since it shows up throughout: these are the systems that stop production or create a safety risk if they fail — glycol/chiller, boiler, air compressor, CIP pump, main process pumps, PRVs and pressure vessels. Everything downstream gets less frequent attention. Keep that in mind as you work through this.
The Weekly Operator Checklist (Tier‑1)
Designed to fit on one page, print landscape, and live in a sheet protector. The operator initials each line. If anything gets a "No," it goes on the failure log regardless of whether it caused downtime.
WEEKLY — Tier‑1 Operator Walk (10–15 min)
-
[ ] Glycol chiller
inlet/outlet temps within range? (record both)
-
[ ] Glycol reservoir level between marks? No visible leaks at fittings?
-
[ ] Air compressor
tank pressure holds at setpoint? Drain condensate.
-
[ ] Compressor oil level (if oil-flooded) — check sight glass
-
[ ] Boiler
sight glass water level normal? Flame/burner cycling normally?
-
[ ] CIP pump
no unusual noise, no seal weeping, gauge reads normal
-
[ ] Main process pumps
check for leaks at seals, abnormal vibration
-
[ ] PRVs
visual check, no corrosion/debris on discharge, tag/test date current
-
[ ] Hoses & gaskets in daily use
inspect for cracks, blistering
-
[ ] Any abnormal sounds, smells, or vibrations noted anywhere? (write it down)
Notes / abnormalities: Operator initials: Date: _ Keep it this short on purpose. A 40-line checklist gets fake-completed. Ten honest lines get done.
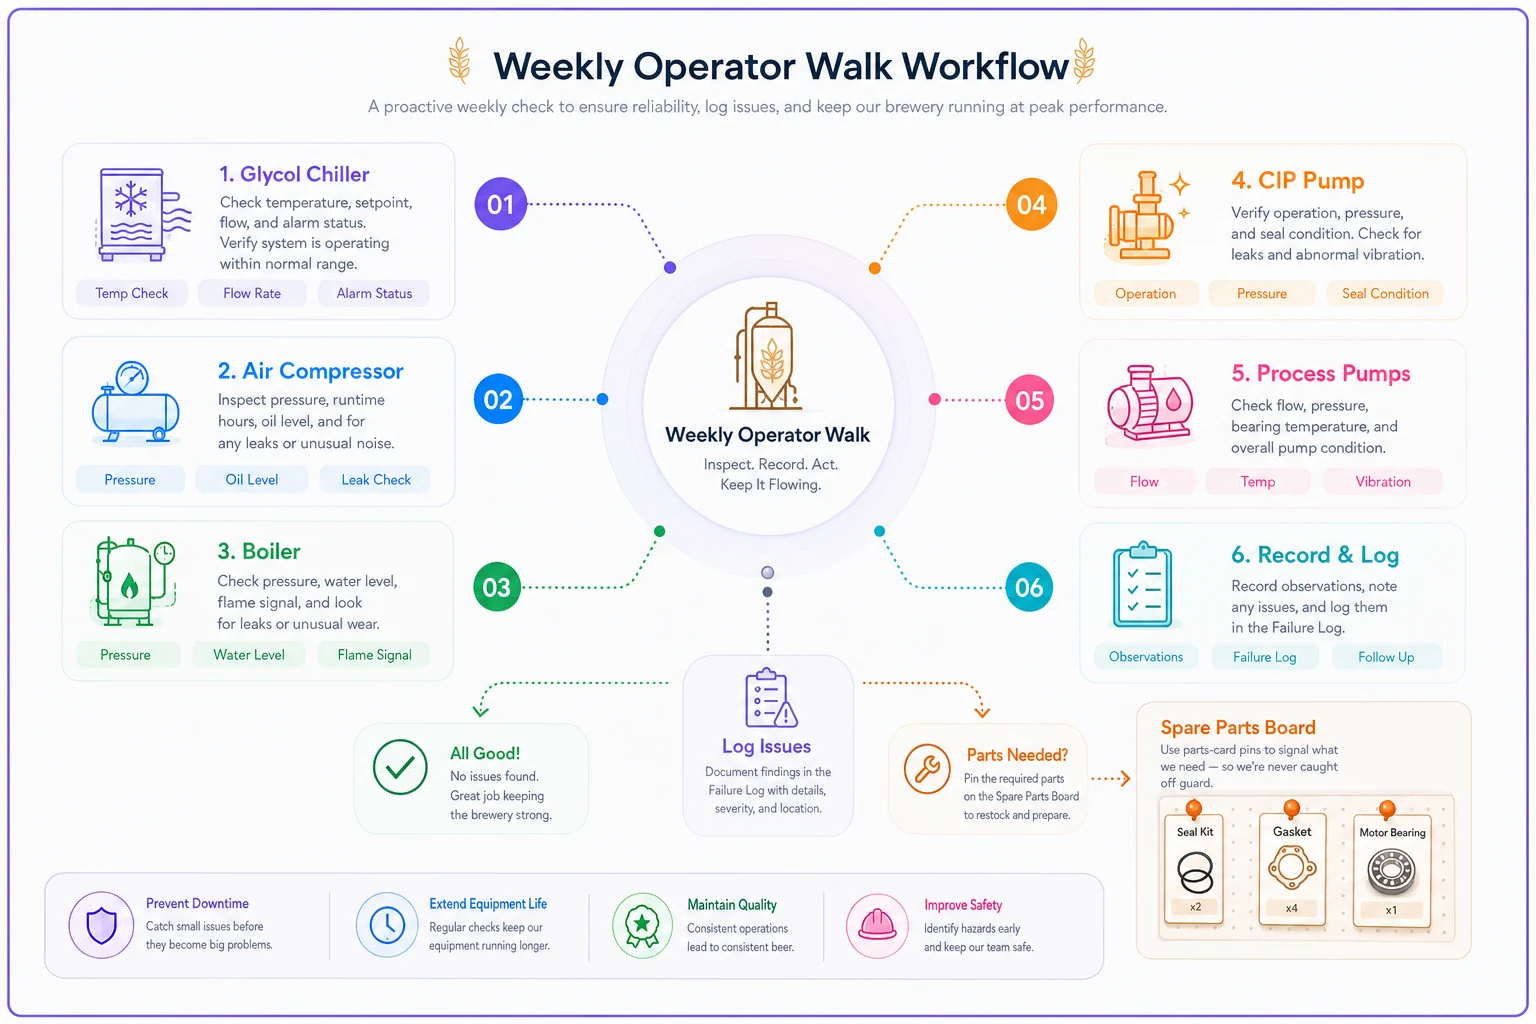
A quick visual to remind people how the walk connects to the failure log and spare-parts cards.
The Monthly PM Checklist (Tier‑1)
More thorough, done by whoever owns maintenance. Still one page.
Take control of your brewery’s workflow.
Beeryly helps you schedule batches, track inventory, and monitor sales with ease.
- Production timeline management
- Inventory tracking & alerts
- Sales & distribution monitoring
No credit card required
MONTHLY — Tier‑1 Preventive Maintenance
-
[ ] Clean chiller condenser coils / check airflow
-
[ ] Verify glycol concentration (refractometer) — top up if drifting
-
[ ] Compressor
change/inspect intake filter, check belt tension, log run hours
-
[ ] Compressor
check air dryer function, drain trap operation
-
[ ] Boiler
blowdown per schedule, inspect for scale, log water treatment readings
-
[ ] CIP & process pumps
inspect/replace seals showing wear, check coupling alignment
-
[ ] Torque critical fittings on pressure lines
-
[ ] Inspect and log all PRV tag dates — flag any within 60 days of recert
-
[ ] Walk every pressure vessel
look for weeping, corrosion, bulging insulation
-
[ ] Review failure log for the month — any repeat offenders?
-
[ ] Verify spare-parts bin counts vs. reorder points (card check — below)
Tip: Generate a QR code linking to the live digital version of each checklist and stick it next to the printed copy. When someone's phone is already out, digital entry wins. When it isn't, paper still works. Both options should be available.
Completed by: Date: Next due: _
The Failure-Log Template (with 6 sample rows)
This is probably the most valuable asset in the whole toolkit, because without a failure log your MTTR and MTBF numbers are guesses. Here are the exact columns and six realistic rows showing how it fills in.
| Failure ID | Date | Asset | Failure Mode | Detected By | Downtime (hrs) | Repair Time (hrs) | Parts Used | Cause | Action/Notes |
|---|---|---|---|---|---|---|---|---|---|
| F-001 | 03/04 | CIP Pump #1 | Mechanical seal leak | Operator (weekly) | 3.5 | 2.0 | Seal kit #SK-220 | Seal wear, ~9 mo in service | Replaced; logged install date |
| F-002 | 03/11 | Glycol Chiller | High head pressure fault | Alarm | 1.5 | 1.0 | None | Dirty condenser coil | Cleaned coil; added to monthly |
| F-003 | 03/19 | Air Compressor | Unloader valve stuck | Operator (weekly) | 2.0 | 1.5 | Unloader kit | Condensate carryover | Fixed drain trap too |
| F-004 | 04/02 | Boiler | Low-water cutoff trip | Alarm | 4.0 | 0.5 | None | Probe scale buildup | Cleaned probe; adjusted blowdown |
| F-005 | 04/15 | Process Pump #2 | Bearing noise/failure | Operator (walk) | 6.5 | 4.0 | Bearing set | No lube schedule existed | Added lube task to monthly |
| F-006 | 04/27 | CIP Pump #1 | Mechanical seal leak | Operator (weekly) | 3.0 | 2.0 | Seal kit #SK-220 | Repeat — check alignment | Flagged for coupling alignment |
A couple of things worth noticing in that table. F-001 and F-006 are the same pump, same failure mode, seven weeks apart. That's your log doing its job — a repeat failure almost always means the root cause wasn't fixed the first time (here, probably coupling misalignment chewing through seals). Also worth looking at the "Detected By" column. When your weekly walk catches problems before an alarm fires, that column fills with "Operator" instead of "Alarm." That shift is one of the clearest signs your PM program is actually working.
Worked MTTR and MTBF (real numbers)
Calculating both for CIP Pump #1 using the log above, since it has two failures.
MTTR (Mean Time To Repair) — average hands-on repair time per failure.
-
Repair times
2.0 hrs (F-001) + 2.0 hrs (F-006) = 4.0 hrs
-
Number of repairs
2
-
MTTR = 4.0 ÷ 2 = 2.0 hours
MTBF (Mean Time Between Failures) — average operating time between failures. This is where people consistently get it wrong, so read carefully.
-
F-001 occurred 03/04, F-006 occurred 04/27. That's 54 calendar days between failures. But MTBF uses operating hours, not calendar time.
-
Say this pump runs during CIP cycles and transfers — roughly 6 operating hours per day, brewery running 6 days a week. Over 54 calendar days that's about 46 operating days, so:
-
Operating hours between the two failures
46 days × 6 hrs = 276 operating hours
-
Number of failure intervals
1 (F-001 to F-006)
-
MTBF = 276 ÷ 1 = 276 operating hours
With more failures logged you'd divide total operating hours by the number of intervals between failures. The single-interval example keeps the arithmetic honest.
How to Count Operating Hours (the part everyone gets wrong)
MTBF is meaningless if two people count hours differently. Lock this down in writing before anyone starts calculating:
-
Count only hours the asset is actually running. A pump idle on a Sunday isn't accumulating operating hours. A chiller is different — it runs continuously, so its operating hours roughly equal calendar hours minus planned-off time.
-
Exclude planned downtime. Scheduled PM, holidays, and planned shutdowns don't count. If the compressor is deliberately off for a long weekend, those 60 hours don't go in the denominator.
-
Exclude the repair window itself. The time the asset is down for a failure isn't operating time.
-
Pick a source of truth. Best
a run-hour meter on the asset. Next best: production schedule hours. Acceptable fallback: a documented assumption like "CIP pump = 6 hrs/operating day," applied consistently.
Whatever assumption you choose, write it on the failure log header and don't change it mid-year. Consistency beats precision here. A slightly imprecise but consistent MTBF still shows you trends. A number calculated three different ways shows you nothing.
Criticality Scoring (1–3 matrix)
You can't PM everything equally. Score each asset 1–3 so your weekly and monthly lists stay focused on what actually matters.
| Score | Label | Definition |
|---|---|---|
| 3 | Critical | Failure stops all production OR creates a safety hazard. No quick workaround. |
| 2 | Important | Failure slows production or affects one line; a workaround exists but it's painful. |
| 1 | Minor | Failure is an annoyance; production continues, repair can wait days. |
Scored example — Glycol Chiller (single unit, no backup):
-
Production impact if it fails
all fermentation temp control lost → 3
-
Safety
low direct hazard, but the production score dominates
-
Workaround available
none (single unit) → reinforces 3
-
Final criticality
3 (Critical)
→ gets weekly checks, monthly PM, and priority spares stocked
Score honestly. The most common mistake is inflation — everything becomes a "3" and the matrix stops meaning anything. If more than roughly a third of your assets are scoring 3s, the scoring is too loose.
Roles & Escalation Matrix (Tier‑1 SLAs)
Who does what, and how fast, when a Tier‑1 system throws a fault.
| Role | Responsibility | Response SLA (Tier‑1) |
|---|---|---|
| Operator | First detection, log entry, basic reset/restart if safe | Immediate — within the shift |
| Lead Brewer / Shift Lead | Assess, attempt repair, decide escalation | Within 30 min of notification |
| Maintenance Owner | Diagnose, repair, order parts, update log | Same day for criticality-3 |
| Owner/Production Mgr | Approve emergency spend, call outside techs | Within 2 hrs for a line-down event |
| Certified Tech (external) | Boiler, PRV, pressure-vessel, refrigerant work | Per contract — have the number posted |
Post this near the maintenance board. The biggest delay in small breweries usually isn't the actual repair — it's the 40 minutes spent figuring out who's allowed to approve a $600 emergency part order at 7 a.m.
Spare-Parts Card + Worked Reorder Point
One index card (or one row in a sheet) per critical spare. Pin the cards to the parts bin.
SPARE-PARTS CARD Part name: CIP pump mechanical seal kit Part #: SK-220 Fits asset(s): CIP Pump #1, CIP Pump #2 Supplier: Phone: Lead time: 7 days Avg daily usage: 0.03 (≈1 seal/month across 2 pumps) Safety stock: 1 Reorder point: __ (calc below) Current on hand: _ Last ordered: __
Worked Reorder Point using ROP = (Lead Time × Avg Daily Usage) + Safety Stock:
-
Lead time
7 days
-
Avg daily usage
0.03 seals/day
-
Safety stock
1
-
ROP = (7 × 0.03) + 1 = 0.21 + 1 = 1.21 → round up to 2
So when seal kits on hand drop to 2, you reorder. For slow-moving critical parts like this, safety stock dominates the number — and that's correct. A seal kit costs almost nothing compared to a day of lost CIP capacity. For a faster-moving consumable the math shifts. A gasket used roughly once a day with a 10-day lead time and safety stock of 3: ROP = (10 × 1) + 3 = 13. Now lead time is driving the reorder point, not safety stock.
KPI Targets by Tier + a 90-Day Target-Setting Method
Don't copy someone else's targets. Set yours from your own baseline first. These ranges are reasonable starting points, not gospel:
| KPI | Tier‑1 (Critical) | Tier‑2 (Important) | Tier‑3 (Minor) |
|---|---|---|---|
| PM completion rate | ≥ 95% | ≥ 85% | ≥ 70% |
| Unplanned downtime (% of operating hrs) | < 2% | < 5% | not tracked |
| % failures caught by operator before alarm | ≥ 60% | ≥ 40% | — |
| MTBF trend | rising | rising | flat OK |
The conservative 90-day method:
-
Days 1–30 Don't set targets. Just log. You're building a baseline. Run the failure log and record PM completion honestly, even if the numbers are rough.
-
Days 31–60 Calculate your actual baseline. Set your first target at baseline + a modest improvement — if PM completion is running at 68%, target 80%, not 95%.
-
Days 61–90 Tighten by one step only on KPIs you actually hit. Targets you missed stay put until you understand why.
Setting a 95% target on day one when you're running at 68% guarantees the number gets ignored by week two. Start where you are.
Safety-Critical Inspection Frequencies — and When to Call a Certified Tech
This is where DIY stops. These items carry real injury risk and often have legal and insurance requirements attached. Frequencies below are typical starting points — your local code, insurer, and manufacturer specs override anything listed here.
| System | Routine (in-house) | Certified Tech Required |
|---|---|---|
| PRVs (pressure relief valves) | Monthly visual, keep tag dates logged | Testing/recert per local code (often annual); any valve that won't reseat |
| Pressure vessels (BBTs, unitanks rated for pressure) | Monthly visual for corrosion/weeping/bulging | Formal inspection per jurisdiction; any sign of deformation |
| Boilers | Daily water level check, scheduled blowdown, log readings | Annual certified inspection; any combustion/safety-control issue |
| Compressed air (compressor + receiver tank) | Weekly condensate drain, monthly filter/belt checks | Receiver tank inspection per code; relief valve testing; major component failure |
The rule of thumb: anything involving recertification, combustion, refrigerant handling, or a code-mandated inspection goes to a certified tech. The money you think you're saving disappears the first time an insurer denies a claim because your boiler inspection wasn't current.
Minimal CMMS Decision Checklist
You may not need software yet. Run through this before buying anything:
-
[ ] Are you tracking more than ~15 Tier‑1/Tier‑2 assets?
-
[ ] Is your failure log already living in a spreadsheet that's getting unwieldy?
-
[ ] Do you have more than one person doing maintenance (coordination problem)?
-
[ ] Are you missing PMs because nobody gets reminded?
-
[ ] Do you want MTTR/MTBF calculated automatically instead of by hand?
-
[ ] Do you need audit-ready records for inspections/insurance?
If you checked 3 or fewer, a well-built shared spreadsheet and printed checklists is honestly fine — don't over-buy. If you checked 4 or more, a lightweight CMMS or AI-powered operational platform starts making real sense. The better ones handle PM scheduling, failure logging, and automated reminders without someone manually chasing completions or rebuilding the MTTR/MTBF math every month. The point isn't the software itself — it's getting reminders and record-keeping off human memory, because human memory is exactly what fails on a busy brew day.
Procurement Playbook: Long-Lead & Single-Source Parts
The parts that wreck your week aren't the common ones. They're the single-source component with an 8-week lead time that you didn't know was single-source until it failed.
-
Flag single-source parts in your spare-parts cards. Add a line
"Sole supplier? Y/N" and "Lead time if >2 weeks."
-
For anything with lead time over ~3 weeks on a criticality-3 asset
stock one, always. The carrying cost is trivial next to the downtime.
-
Identify a cross-reference or second source now, while nothing's broken. Many "proprietary" pump seals have direct equivalents.
-
Put long-lead critical parts on a standing check — their reorder point should trigger earlier, because a late reorder means weeks down, not days.
-
Keep the supplier phone number on the card, not buried in email. When something goes down at 6 a.m., you want to be dialing, not searching.
Breweries that avoid multi-week outages don't necessarily react faster — they stock smarter. One correctly-chosen long-lead spare on the shelf is worth more than the fastest emergency-shipping account you can open.
A Real Scenario
A roughly 4,000 bbl/year production brewery with two CIP pumps and a single glycol chiller kept eating surprise seal failures — about one every 5–6 weeks across the pair, each costing 3–4 hours of lost CIP time plus a parts scramble. No log, no spare seals on hand, so every failure meant overnight shipping.
They put the failure log and spare-parts cards above into use. Within two months the log showed what was actually happening: one specific pump was responsible for most of the failures, and the root cause was coupling misalignment, not bad seals. They fixed the alignment, set a reorder point of 2 on the seal kits, and added the weekly seal-weep check to the operator walk.
Over the following quarter, seal failures on that pump dropped from roughly one every 5–6 weeks to one in the entire period. The overnight-shipping scrambles stopped because the shelf always had two kits. Nothing exotic — just a log that showed what was actually breaking and a little discipline around stocking the one part that kept mattering.
Use What You Need, Ignore the Rest
You don't have to implement all of this at once. If you do nothing else this week, print the weekly operator checklist and start the failure log — those two things generate the data everything else depends on. The MTTR/MTBF math, the KPI targets, the reorder points: none of it works without a few weeks of honest logging first.
Everything here is meant to be copied, edited to your equipment, and put to work. Change the assets, change the numbers, keep the structure. The breweries that stay out of breakdown firefighting aren't the ones with the fanciest tools — they're the ones whose operators have a clipboard they actually fill in, and a shelf that has the right part on it when the pump quits.
Everything here is meant to be copied, edited to your equipment, and put to work. Change the assets, change the numbers, keep the structure. The breweries that stay out of breakdown firefighting aren't the ones with the fanciest tools — they're the ones whose operators have a clipboard they actually fill in, and a shelf that has the right part on it when the pump quits.
Ready to elevate your brewery operations?
Join 500+ craft breweries using Beeryly to increase production efficiency, reduce waste, and grow sales.