


Most benchmarking advice for breweries is close to useless because it compares a 900-barrel nanobrewery to a 40,000-barrel regional producer and acts like the same "good" number applies to both. It doesn't. A yeast cost per barrel that's perfectly healthy at a taproom-first brewpub would be a crisis at a distribution-heavy packaging brewery. The number means nothing until you normalize it by size and business model.
So this piece does two things. First, it lays out benchmark bands — ranges, not single targets — segmented by annual volume and brewery type. Second, it ties each band to a specific next-step project, because a metric you can't act on is just a number on a dashboard that makes you feel vaguely anxious. There's also a month-one starter template at the end so you can actually begin, instead of spending three weekends building a spreadsheet you'll abandon.
One thing to get straight before we dive in: benchmarks are a diagnostic tool, not a report card. The goal isn't to hit some industry average. It's to spot where your operation is leaking money or time relative to breweries that look like yours, then fix the biggest leak first.
Why most brewery benchmarking fails before it starts
The breweries that get real value out of benchmarking all do the same unglamorous thing: they normalize. The ones that don't usually make one of three mistakes.
The first is comparing raw dollars instead of per-barrel or per-unit figures. "$18k spent on packaging materials last month" tells you nothing. $18k across 1,200 barrels is a completely different story than $18k across 400 barrels. Everything has to come back to a denominator — barrels produced, barrels sold, cases packaged, labor hours.
The second mistake is mixing brewery types. A brewpub selling 70% of its volume through its own taproom has completely different economics than a production brewery pushing everything through distribution. The taproom brewery can absorb higher per-barrel production costs because revenue per barrel runs 3–4x higher. If you benchmark them against each other, you'll end up fixing things that aren't broken and ignoring things that are.
The third, and quietest, killer is inconsistent definitions. Does your "yield loss" include tasting-room pours? Does "COGS per barrel" include freight? Two breweries using the same metric name with different formulas will produce numbers that look comparable and aren't. This is why the data model underneath your benchmarking matters as much as the benchmarks themselves.
How to segment: size bands and type bands
Benchmarking only works when you're comparing like to like. Use two axes.
Take control of your brewery’s workflow.
Beeryly helps you schedule batches, track inventory, and monitor sales with ease.
- Production timeline management
- Inventory tracking & alerts
- Sales & distribution monitoring
No credit card required
By annual volume:
-
Nano/small under ~1,500 BBL/year
-
Mid-small ~1,500–7,500 BBL/year
-
Mid ~7,500–25,000 BBL/year
-
Regional 25,000+ BBL/year
By revenue model:
-
Taproom-first majority of volume sold on-premise
-
Hybrid meaningful split between taproom and distribution
-
Distribution-first majority sold through wholesale/retail
Where you land on both axes determines which benchmark band applies. A 5,000 BBL distribution-first brewery and a 5,000 BBL taproom-first brewery sit in the same volume band but should be reading completely different cost and labor targets.
The benchmark bands
What follows are normalized bands drawn from patterns across small and mid-sized breweries. Treat them as ranges to orient yourself, not hard pass/fail lines. Your specific equipment, beer styles, and market will shift them.
| Metric (normalized) | Nano/Small | Mid-small | Mid | Regional | Notes |
|---|---|---|---|---|---|
| Brewhouse yield (% of theoretical) | 78–85% | 83–88% | 86–91% | 89–93% | Lower end expected with manual systems |
| Packaging loss (% of finished beer) | 6–12% | 4–8% | 3–6% | 2–4% | Taproom-heavy breweries run higher |
| Labor hours per BBL produced | 4–8 | 2.5–5 | 1.5–3 | 0.8–2 | Includes cellar + packaging |
| Total COGS per BBL (production only) | $110–170 | $95–140 | $85–120 | $75–105 | Excludes freight/distribution |
| CO₂ / utilities per BBL | $12–25 | $9–18 | $7–14 | $5–11 | Varies hugely by region |
| Tank turns per year | 8–14 | 12–20 | 16–26 | 20–30+ | Driven by conditioning discipline |
| Finished-goods days on hand | 25–50 | 20–40 | 15–30 | 12–25 | Distribution-first should run lower |
| On-time production run % | 70–85% | 80–90% | 88–95% | 92–97% | Schedule adherence |
A couple of patterns worth calling out. Labor per barrel drops sharply as you scale — not because bigger breweries hire magical people, but because batch sizes grow faster than crew size and more steps get automated or parallelized. And packaging loss: the difference between a well-run mid-size line at 4% and a struggling one at 10% is enormous once you convert it to lost beer at your wholesale price.
Treat these bands as ranges to orient yourself, not hard pass/fail lines. Your specific equipment, beer styles, and market will shift them.
Next-step projects tied to each band
This is where benchmarking actually earns its keep. Each metric band points to a specific project depending on where you fall.
Brewhouse yield
-
If you're below band for your size Start a weekly yield reconciliation by batch. Track knockout volume vs. recipe target and flag any batch more than ~5% off. Most low-yield problems trace to inconsistent mash efficiency, under-measured trub losses, or sloppy volume measurement — and you can't fix what you're not tracking per batch.
-
If you're mid-band Focus on the top two or three recipes by volume. Dialing in yield on your flagship beer moves the aggregate number far more than tweaking a seasonal you brew twice a year.
-
If you're top-of-band Leave it alone and put your energy elsewhere. Chasing the last 1% of yield when you're already at 91% is rarely the highest-value project on your board.
Packaging loss
-
Below band (losing too much) Run a time-motion study on your changeovers and fill process. A lot of "loss" is really foaming, overfills, and purge waste at line start/stop. Our breakdown on reducing packaging changeover downtime with time-motion checklists and parallel prep walks through how to find where the beer and the hours actually go.
-
Mid-band Attack the single worst SKU. There's almost always one package format or beer dragging the whole average down.
Labor hours per BBL
-
Below band (too high) Map your cellar and packaging workflow step by step and look for the handoffs where someone is waiting on someone else. Idle time hides inside what look like busy days.
-
Mid-band Batch-size standardization. Inconsistent batch sizes force constant recalculation and setup, which quietly inflates labor without anyone noticing.
On-time production and tank turns
-
These two are more connected than people usually realize. Low tank turns typically mean conditioning schedules overlap and tanks get held longer than necessary, which pushes runs late. If your on-time run percentage is below band, the fix usually isn't working faster — it's scheduling smarter.
Read the whole board, trace the ripple back to the source, and fix the root link. The metrics that sit upstream — yield, batch consistency, schedule adherence — are usually where the real leverage is.
A workflow view: how the metrics connect
Benchmarks look like a list, but your operation is a chain, and a weak number in one link shows up as a bad number three steps later.
The flow: a batch knocks out of the brewhouse at lower-than-target yield. That means you need slightly more batches to hit the same packaged volume, which eats extra brew days and inflates labor hours per barrel. Those extra batches occupy fermenters longer than planned, dropping your tank turns. Fewer available tanks force the scheduler to push runs back, hurting on-time production percentage. Late runs mean finished goods arrive closer to ship dates, so you build buffer inventory just in case, which raises days-on-hand and ties up working capital.
Below is a simple workflow view that shows how a single upstream issue can ripple through operations.
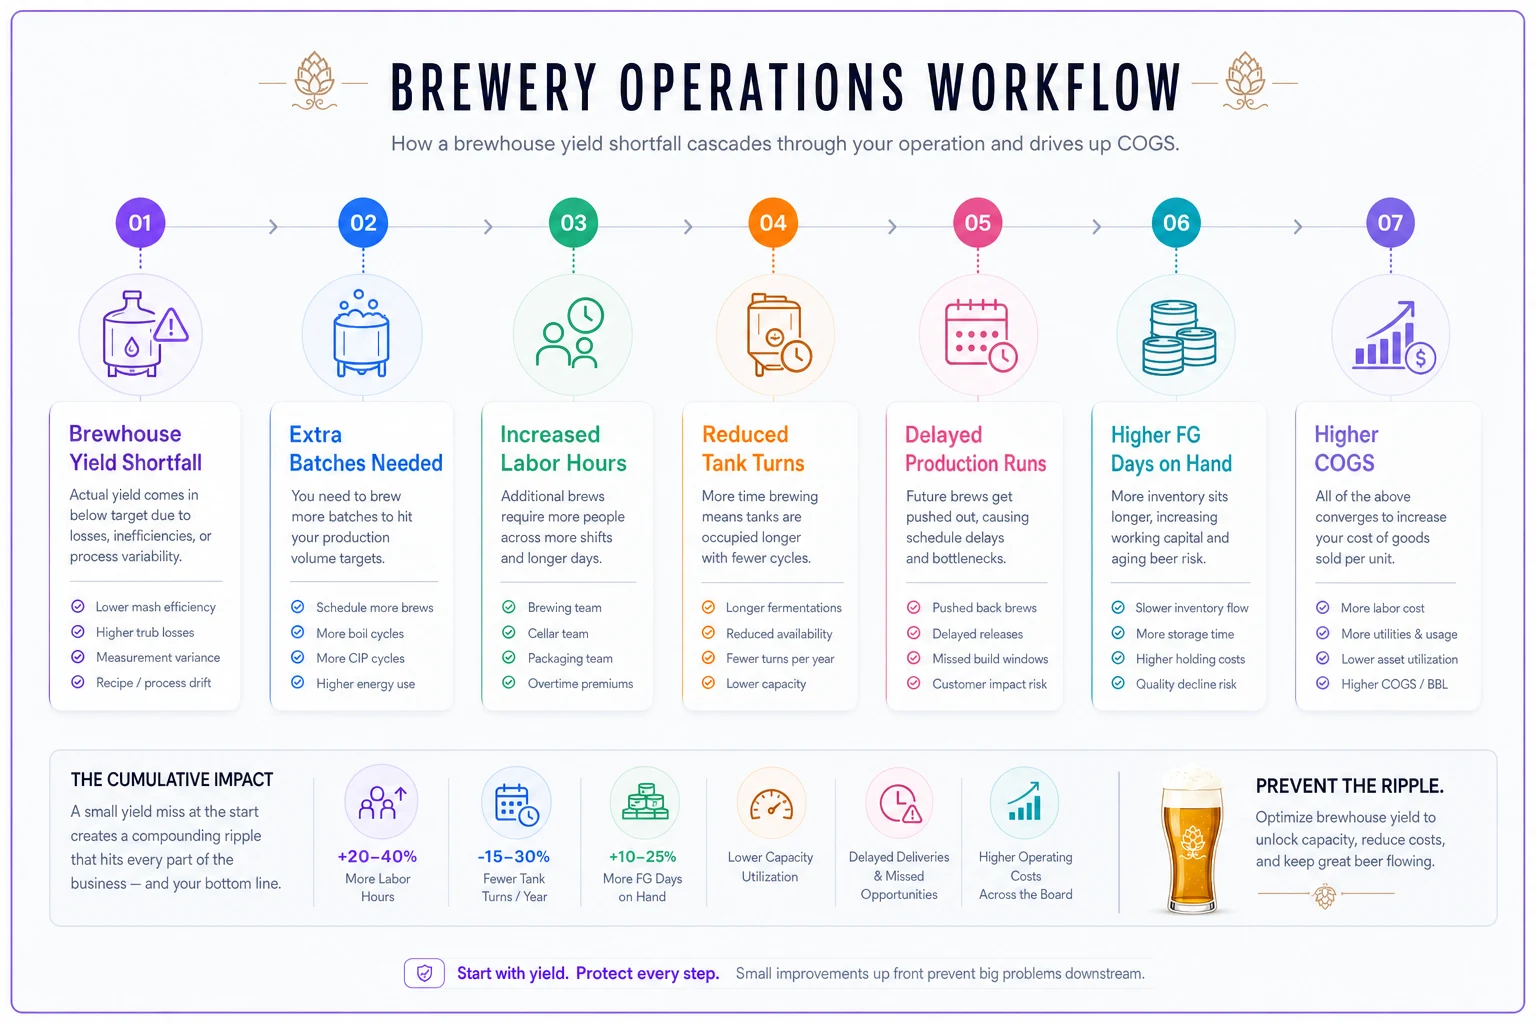
One weak yield number rippling through five other metrics. This is why benchmarking a single metric in isolation leads people to fix the wrong thing.
A real scenario
A hybrid brewery, roughly 4,200 BBL/year, split about 55/45 between taproom and distribution. On paper things looked fine — the beer was good, the taproom was busy. But COGS per barrel kept creeping up and nobody could say exactly why.
When they finally normalized their numbers, two things jumped out. Packaging loss was sitting around 9–10%, well above the 4–8% band for their size. And brewhouse yield was hovering near 81%, bottom of the band. Both were quietly pushing COGS toward the high end — around $135/BBL on production alone.
They didn't try to fix everything at once. They picked the two upstream levers. For yield, they started per-batch reconciliation and discovered one of their two systems was consistently measuring knockout volume short, which had been throwing off their recipe scaling for months. For packaging, a changeover study revealed most of the loss was foaming at line startup on their most-packaged SKU.
Over about two quarters, yield moved into the mid-80s and packaging loss settled closer to 6%. COGS per barrel came down into the low $120s. Nothing dramatic month to month — it was a slow correction — but across their volume it added up to real money. The working-capital relief from carrying less buffer inventory was almost as valuable as the cost savings.
Month-one benchmarking starter template
You don't need a data warehouse to begin. You need consistent definitions and one place to record them. Here's a realistic month-one plan.
-
Week 1 — Pick your segment and five metrics. Don't track everything. Choose brewhouse yield, packaging loss, labor hours per BBL, tank turns, and on-time run percentage. Lock down the exact formula for each, in writing, so next month's number is actually comparable.
-
Week 2 — Build the collection habit. Decide where each number gets recorded and by whom. The recording point should be as close to the physical event as possible — yield logged at knockout, packaging loss logged at end of run, not reconstructed from memory on Friday afternoon.
-
Week 3 — Capture one full cycle. Log every batch and every packaging run for the week. Expect gaps and messy data. That's normal and actually useful — the gaps show you where your record-keeping is weak.
-
Week 4 — Normalize and compare. Convert everything to per-barrel or percentage terms, drop it against the bands above, and identify your single worst-performing metric relative to your size band.
A quick checklist for whether your benchmarking is actually set up to work:
-
[ ] Every metric has a written formula, not just a name
-
[ ] Each number is normalized to barrels, cases, or hours
-
[ ] You've segmented by both volume and revenue model
-
[ ] Data is captured at the event, not reconstructed later
-
[ ] You review the board as a connected system, not a list
-
[ ] You've picked ONE next-step project, not ten
Record yield at knockout; capture data at the event to avoid reconstruction.
Your month-one deliverable is one sentence: "Our weakest metric versus our size band is , and our next-step project is ." That's it. One leak, one project.
When benchmarking isn't worth it yet
Benchmarking makes the most sense once you're producing consistently enough that your numbers actually mean something. If you're brewing sporadically or your recipes and batch sizes change every run, your data will be too noisy to compare against anything useful. Get to a stable production rhythm first.
It's also a bad idea to benchmark aggressively if you're not prepared to act on what you find. Tracking a dozen metrics you never use just adds admin overhead and makes the team cynical about data. Track fewer things, and actually run the projects they point to.
And if you're a pure taproom brewpub with no distribution ambitions, some of these bands — days on hand, distribution-oriented COGS — matter far less to you. Focus on yield, labor, and tank turns. Use the parts of the framework that fit your model and ignore the rest.
Where software quietly helps
Most of the pain in benchmarking isn't the analysis — it's the collection. Numbers logged by hand on clipboards and re-keyed into spreadsheets drift, get skipped on busy days, and lose the per-batch granularity that makes benchmarking useful in the first place. This is where an AI-powered operational platform that captures yield, packaging, labor, and schedule data at the moment the work happens starts paying for itself — it removes the reconstruction step entirely and keeps definitions consistent across every batch and every operator.
The value isn't a fancier dashboard. It's that the number you look at next month was captured the same way as last month's, so the comparison actually holds. You don't need that to start — a disciplined spreadsheet gets you through month one — but it's usually what makes benchmarking stick once you're past the first quarter.
Start small, normalize honestly, and let the bands point you toward the one project that'll move the most money. Not a perfect dashboard — just a clear read on where you're leaking relative to breweries that look like yours, and the discipline to fix the biggest leak first.
Ready to elevate your brewery operations?
Join 500+ craft breweries using Beeryly to increase production efficiency, reduce waste, and grow sales.