
Most brewery QC sampling plans look impressive on paper. Color-coded spreadsheets, detailed SOPs, fancy testing equipment. Then a batch of contaminated beer makes it to distribution because someone sampled the wrong valve at the wrong time.
The disconnect happens because sampling plans get designed for auditors, not operators. Your cellar operator pulling samples at 6 AM doesn't care about statistical confidence intervals. They care about which valve to sample, when to pull it, and what to do if something looks off.
Working with dozens of breweries on their QC workflows shows a clear pattern: effective sampling isn't about testing more — it's about testing smarter. The breweries catching problems early aren't the ones with the biggest lab budgets. They're the ones whose sampling cadence matches their actual production risks.
Why standard sampling plans fail in craft brewing operations
Traditional QC sampling templates come from large-scale manufacturing where production is predictable. Same volume every day, same products, same risks. Craft breweries operate differently.
Your 15-barrel system might package a hazy IPA on Monday, a barrel-aged stout on Wednesday, and a kettle sour on Friday. Each beer carries different contamination risks. Each requires different sampling points. Yet most breweries use the same sampling schedule for everything.
Production volume variance kills standard approaches. A brewery producing 800 BBLs annually might brew the same beer once a month or once a quarter. Standard sampling frequencies designed for continuous production become either excessive (wasting time and beer) or insufficient (missing problems).
Your packaging team consists of three people who also handle transfers, CIPs, and deliveries. When QC procedures require complex decision trees or multi-page flowcharts, shortcuts happen. Not from laziness — from necessity.
Building sampling cadence around actual risk patterns
Smart brewery QC sampling plans start with risk mapping, not testing schedules. Different beers, different equipment, different stages of production all carry unique contamination risks.
Take control of your brewery’s workflow.
Beeryly helps you schedule batches, track inventory, and monitor sales with ease.
- Production timeline management
- Inventory tracking & alerts
- Sales & distribution monitoring
No credit card required
Take hop-forward beers versus clean lagers. That NEIPA with 8 pounds per barrel of dry hops faces exponentially higher contamination risk than your pilsner. Yet many breweries test both at the same frequency.
Risk-based sampling looks like this:
High-risk trigger points:
-
First 5 BBLs after dry hop additions
-
Any beer over 7% ABV going into cans
-
First run after CIP on problem tanks
-
Mixed-culture beers at any transfer point
-
Anything touching fruit additions
Low-risk safe zones:
-
Third consecutive batch of house lager
-
Middle of a long packaging run
-
Established flagships with clean history
-
Fresh beer going to draft only
-
Sub-4% ABV session beers
The formula that works: (Base Risk Score × Volume Factor × History Modifier) = Tests per batch
Example: Your 6% IPA (base risk: 3) producing 30 BBLs (volume factor: 1.5) with clean history (modifier: 0.8) needs roughly 4 sampling points. Your barrel-aged imperial stout (base risk: 5) at 7 BBLs (volume factor: 1) with previous issues (modifier: 1.5) needs 8 sampling points despite lower volume.
The operator-first sampling workflow
Most contamination gets caught by operators noticing something "feels off" long before lab results confirm it. The trick is channeling that intuition into documented sampling triggers.
Start with visual and sensory triggers that operators already notice:
Pull immediate samples when:
-
Foam looks different during transfer
-
Unusual smell during tank venting
-
Clarity changes mid-packaging run
-
Yeast behavior seems off in sight glass
-
Any equipment makes unexpected sounds
Give operators exactly three steps when they suspect issues:
-
Pull sample into labeled 50mL tube
-
Text photo to QC lead with tank/time
-
Continue run but mark cases/kegs
No forms, no computer entries, no production stops. The simplicity means it actually happens.
Your escalation flowchart needs similar simplicity:
Positive microbial result on packaged beer:
-
If less than 24 hours
Hold all inventory, retest
-
If 24-48 hours
Pull distributed samples, notify accounts
-
If over 48 hours
Full recall protocol
Positive on bright tank:
-
If pre-carbonation
Filter or pasteurize
-
If carbonated
Evaluate dump vs. draft only
-
If packaged
See above
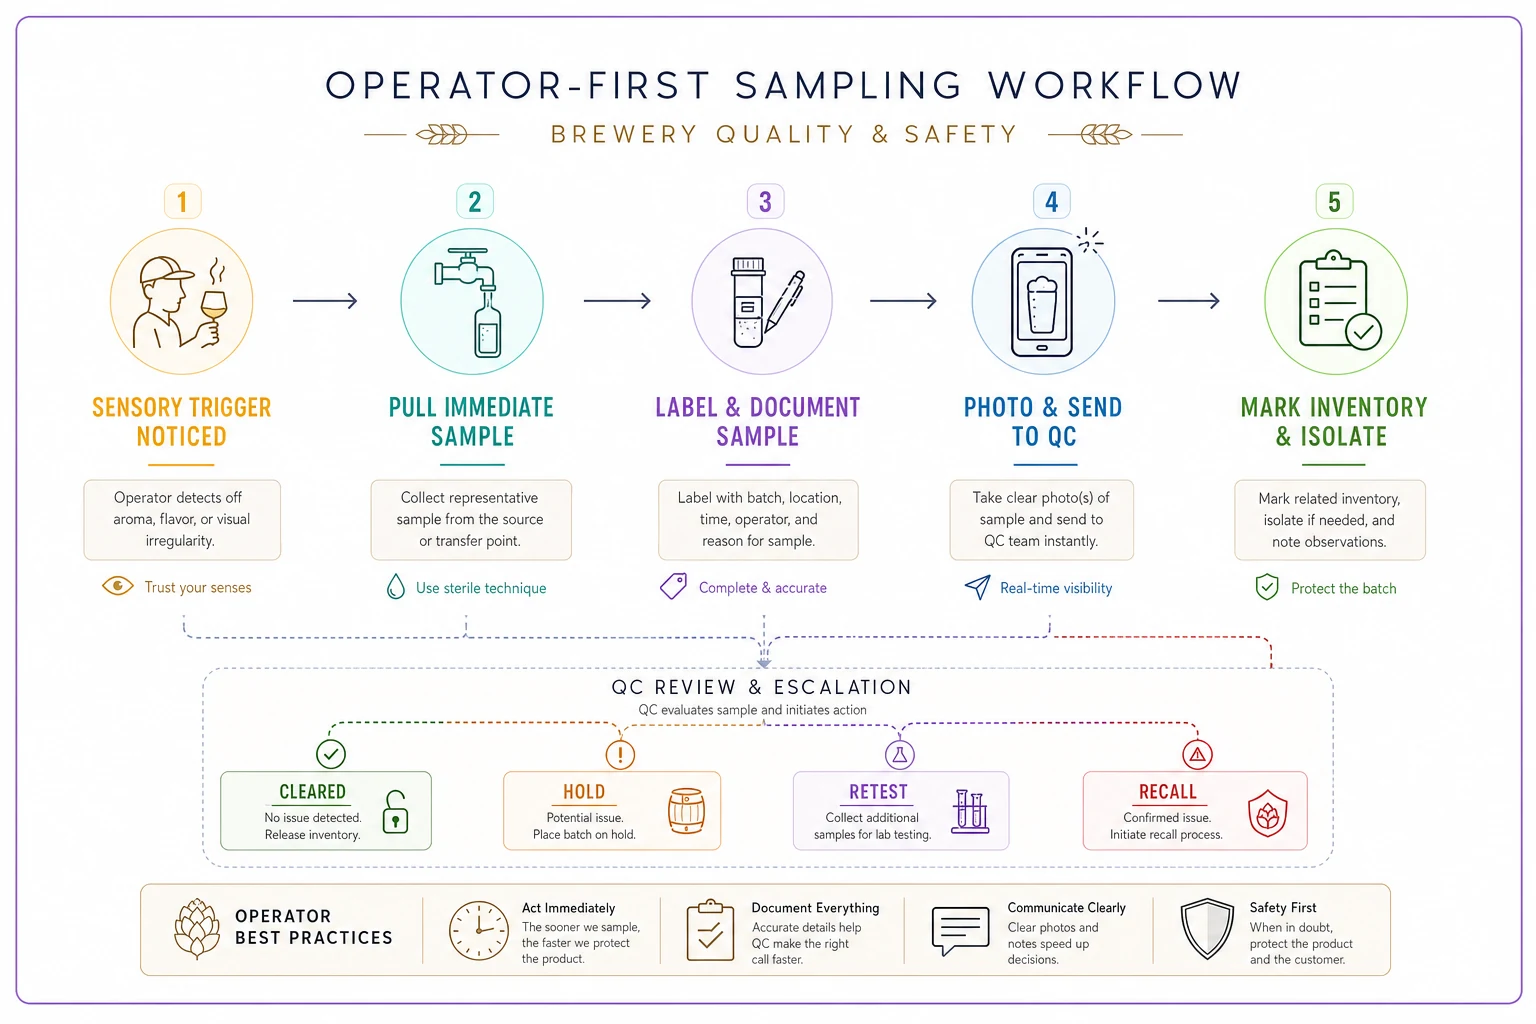
This simple workflow diagram outlines operator triggers, immediate actions, and escalation steps.
Sample logging that drives prevention, not just documentation
Sample logs in most breweries exist for one reason: proving you tested stuff when auditors show up. Good sample logs reveal patterns that prevent future problems.
The tracking system that works captures four things:
-
Where (specific valve/port)
-
When (production stage, not just date)
-
Who (operator pulling sample)
-
What happened next
That last part is crucial. Recording what you did with the information matters more than the test result itself.
A 2,000 BBL/year brewery noticed contamination appearing every third Monday in their flagship IPA. Standard logging showed nothing useful — just dates and pass/fail results. Deeper tracking revealed the pattern: their part-time cellar operator worked Mondays and consistently pulled samples from the racking arm instead of the dedicated sample valve.
Essential sample log fields:
| Field | Why It Matters | Example Entry |
|---|---|---|
| Sample Point ID | Identifies contamination sources | "BT-03 Racking Arm" |
| Production Stage | Links issues to process steps | "Post-dry hop Day 2" |
| Volume Produced | Scales response to risk | "15 BBL of 30 BBL batch" |
| Visual Notes | Catches problems before lab | "Slight haze, normal foam" |
| Action Taken | Tracks effectiveness | "Held for retest" |
| Operator Notes | Captures intuition | "Valve felt sticky" |
Skip fields like weather, pH (unless relevant), or gravity readings that don't affect contamination risk.
Track operator IDs on each sample to detect operator-specific patterns quickly.
Every field should either identify problems or prevent them.
Real contamination catches from pattern recognition
The breweries best at contamination prevention aren't lucky — they're observant. Their sampling plans create data patterns that reveal problems before they become disasters.
A 15-barrel brewpub started tracking sampling results against packaging runs. After three months, contamination only appeared in beers packaged on their mobile canning line during afternoon runs. Investigation revealed the canning truck's glycol system couldn't maintain temperature above 85°F ambient. Morning runs stayed clean.
Solution: Schedule sensitive beers for morning runs only during summer months. Zero contamination events since.
Another brewery identified their contamination source through operator-specific tracking. One cellar worker consistently had higher positive rates, but only on specific tanks. Turned out they were tall enough to reach sample valves without a ladder on most tanks, but needed one for tanks 5 and 6. To save time, they'd sample from the bottom valve instead. Those bottom valves hadn't been properly cleaned in months.
These patterns only emerge when your logging system tracks the right variables.
Matching sampling frequency to production reality
The textbook says sample every batch. Reality says you're brewing four different beers this week with two people who also handle packaging, cleaning, and transfers.
Volume-based minimums:
-
Under 7 BBL batch
Beginning and end
-
7-15 BBL
Add mid-fermentation
-
15-30 BBL
Add daily during dry hop
-
Over 30 BBL
Full protocol every 12 hours
Risk multipliers:
-
Fruit additions
Double frequency
-
Barrel-aging
Triple frequency
-
Over 8% ABV
1.5x frequency
-
Sour/wild
Continuous monitoring
-
Historical issues
2x for 6 batches
A 10 BBL clean lager needs 3 sample points. A 10 BBL fruited sour needs 12. Same volume, different risk, different sampling plan.
Operational reality check: if your sampling plan requires more than 30 minutes of operator time per batch, it won't get followed. Build yours backwards from available time, not forward from ideal coverage.
The prevention checklist operators actually use
Forget 10-page SOPs. Operators need checklists they can execute while multitasking:
Pre-packaging contamination check (5 minutes):
-
□ Visual
Beer clarity matches standard?
-
□ Smell
Sample valve, normal aroma?
-
□ Taste
No off-flavors detected?
-
□ Microscope
Quick cell count if available
-
□ Decision
Package, hold, or retest?
Daily cellar walk-through (10 minutes):
-
□ Check sample ports for buildup
-
□ Verify sample valve positions
-
□ Look for unexpected krausen/activity
-
□ Note any equipment issues
-
□ Pull samples from active tanks
Weekly prevention tasks (30 minutes):
-
□ Review all positive results for patterns
-
□ Clean/sanitize all sample valves
-
□ Verify sample bottle inventory
-
□ Update risk scores based on results
-
□ Brief team on any protocol changes
Each item takes under 2 minutes and requires no interpretation. An operator can complete these while running other equipment.
When your sampling plan needs software support
Manual logging works until you hit around 50 samples per week. After that, patterns get lost in spreadsheet noise.
The trigger points for considering brewery QC software:
-
Spending over 2 hours weekly on data entry
-
Missing contamination patterns across batches
-
Operators skipping logging due to time
-
Can't trace issues back to source
-
Multiple people need access to results
Modern brewery QC platforms handle the tedious parts: automatic sample scheduling based on your risk matrix, mobile logging that works on wet phones, instant alerts when results fall outside parameters. More importantly, they spot patterns humans miss — like contamination appearing every 47 hours (matching your yeast supplier's delivery schedule).
AI-powered operational software can analyze sampling patterns across multiple variables simultaneously. Where a human might miss the correlation between contamination events and specific tanks, operators, or environmental conditions, automated pattern recognition identifies these connections faster.
Software only helps if your fundamental sampling plan makes sense. No amount of automation fixes bad sampling points or unclear escalation procedures.
Prevention beats correction every time
A mid-sized brewery in Colorado tracked their contamination costs for a year. Including dumped beer, recalled products, and lost accounts, each contamination event cost them roughly $8,500. They experienced six events annually — over $50,000 in preventable losses.
After redesigning their brewery QC sampling plan around actual risk patterns and operator workflows, contamination events dropped to one per year. The time investment? About 90 minutes weekly in targeted sampling versus their previous 3 hours of random testing.
The difference wasn't more testing or better equipment. It was sampling the right valves at the right times with clear procedures for when things go wrong. Their operators now catch issues during production instead of finding them in the market.
Your contamination prevention system is only as good as its weakest point — usually the 6 AM operator pulling samples alone. Build your sampling plan for them, not for your QC manager or auditor. When operators understand not just what to sample but why and what to do next, prevention happens automatically.
The math is simple: every contamination event you prevent saves roughly 300 cases of beer from recall. That's worth getting your sampling cadence right.
Ready to elevate your brewery operations?
Join 500+ craft breweries using Beeryly to increase production efficiency, reduce waste, and grow sales.